August 2024 Newsletter
Opening Thoughts: Education and Networking
Since 2004, I have actively participated in the development and interacted with educational platforms designed for investors and alternative investments. Throughout this time, I have collaborated with numerous esteemed organizations and professionals. Our main goal has always been to provide excellent education and networking opportunities for investors. Now, after two decades, we are starting a new educational venture focused on the investor, not the industry professional.
The new group is called AltsInvest Collective. We will be organizing in person gatherings in the greater Seattle region for accredited investors looking to network, enhance their understanding, and contribute their insights with the group. The attendees will include individuals outside the investment industry as well as those within it.
It's worth mentioning that the industry professionals you may meet at the AltsInvest Collective events are themselves actively diversifying their personal portfolios with various alternative investments. As investors themselves, like you, they value education and networking opportunities. Moreover, as outlined by the AltsInvest Collective's regulations, uninvited solicitation is not allowed. Therefore, financial experts or any other individuals will not use these events to promote their services or products to you.
Members of the AltsInvest Collective will not only can tap into the institutional wisdom shared by certain members but also gain access to resources and insights that typically would not be accessible to non-institutional investors.
The inaugural event is scheduled for September 26th. In case you haven't received your invitation sent via email, you can utilize this link: https://altsinvestcollective.org/membership. Note that the in-person event is for accredited investors only.
Kirkland Income Fund Update:
Throughout the month of August, the Fund remained almost fully deployed. We had two non-performing loans (NPLs) making substantial progress towards being completely paid off, and we anticipate the final payments to be received within September. Notably, no new stressed loans were added to the portfolio. The majority of the portfolio remains healthy, evidenced by a consistent flow of loans paying off.
Investor Question: With rates looking to adjust in the future are you still seeing loan demand?
We get this question a lot, or a similar question that is driving at the question regarding the capacity of the fund. The fund is currently $33.5 million in Assets Under Management (AUM). We are still targeting $100 million AUM for the fund.
We have lots of room to grow in a space that is estimated to be approximately 200 to 300 billion dollars in size. We are still focused on creating a fund that continues to provide consistent excess returns in comparison to other fixed income investments and are seeing the loan demand to achieve that now and into the future.
Office is Still in Trouble
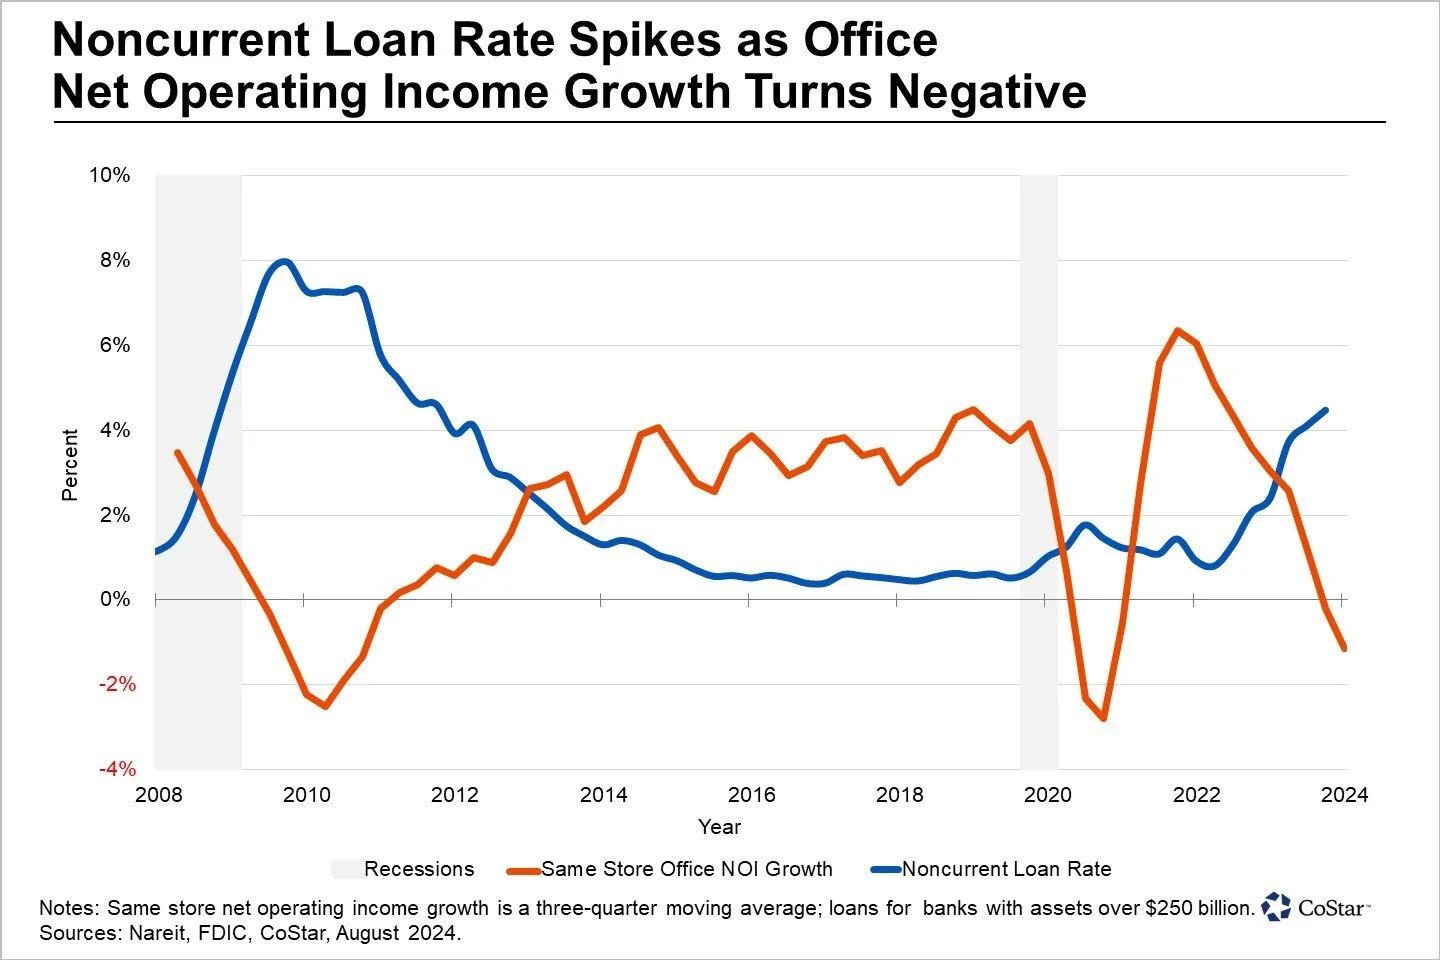
Higher vacancies in offices are impacting more than the building owners. It is also creating a higher percentage of loans that are 90-plus days late on payments, and it is clear the lenders will collect less than the principal value of the loan. Currently the default loan rate is 4.5%. This is the highest rate since Q4 of 2013. We at Kirkland Capital Group believe this number is much higher than reported, as we all know there are many games that can be played to hide problems in a portfolio. (See our previous comments from our June newsletter to mention a few.) Reports only display the data that has been posted or reported. Much like an iceberg, what you see is just a small fraction of the entire issue.
For REIT investors. If you haven't already shifted your portfolio to reduce exposure to office-heavy REITs, you may be in for prolonged hardship and a bumpy journey ahead. According to the latest report from the National Association of Real Estate Investment Trusts (NAREIT), the office sector owned by REITs has experienced a continuous decline in same-store net operating income over the past three quarters. This downward trend in income is leading to an increase in the number of borrowers who are falling behind on their loan payments to banks. Just like the iceberg mentioned above, the visible issues are only the tip of the problem, with a much larger underlying challenge. The FDIC has now identified this as a significant concern, prompting questions about the actions the FDIC will require banks to take in response to these non-performing loans.
According to the FDIC, around 40% of commercial real estate loans are under the purview of banks. While this is a notable statistic, the real intrigue lies in who holds the remaining 60%. The other 60% are in private hands, and their struggles remain undisclosed. It begs the question, do the reports we have truly encapsulate the full narrative? Likely not, as the office sector continues to face challenges, some of which may clearly be obscured from view.
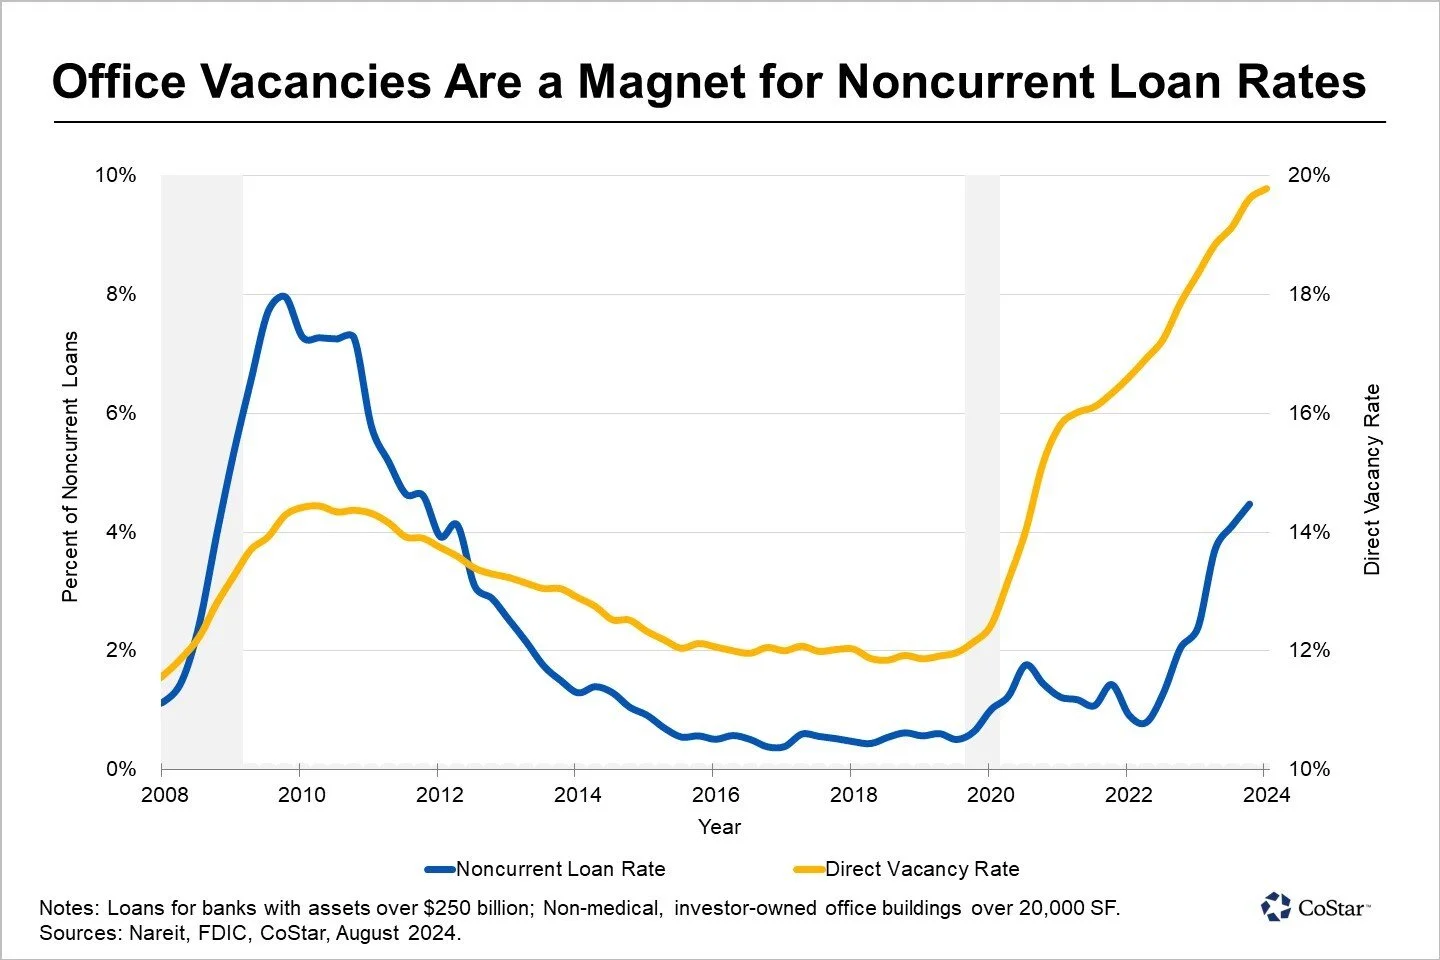
In the chart above the national office vacancy rate peaked at just over 14% in 2010, then slowly eased over the next decade. Vacancy rates have surged to 20%, pulling noncurrent loan rates up as well.
Not tough to see the issue here. These increasing levels of vacancy with no major catalyst to halt the upward move will lead to more non-current loans. Banks are worried and if their money is not going to office then where is the money going? Banks must make loans, and they are naturally focusing on industrial, multifamily and retail. Could be more support for projects in those spaces for the near future.
How could this become a prolonged problem?
More-than-expected non-current loans come to light will cause further tightening of available credit and interest from investors.
Continuing problems will affect the supply and demand aspects of this microcosm, which will leave borrowing rates high. The tightening of credit would keep the cost of capital elevated regardless of the Federal Reserve easing.
Risk and Reward
A little reminder, why do investors look to invest in alternative investments?
Enhance returns for either the equity or fixed Income portions of their portfolio.
Generate greater diversification in the portfolio with a goal to lower volatility of returns.
If you can generate higher returns and lower risk, the new portfolio will obtain a greater return for the risk you are taking.
We regularly share our Risk/Reward Chart on our Performance page and I thought it might be good to show another chart from a large investment research house to show similarities and some differences:
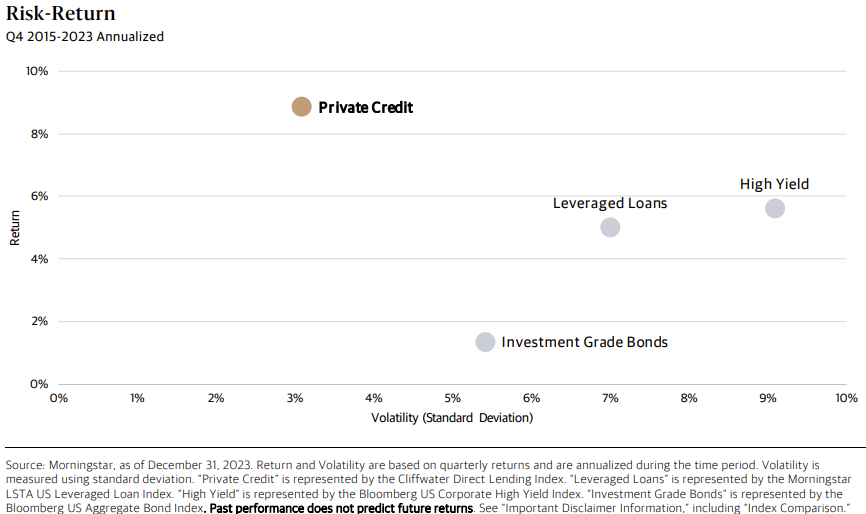
This chart goes back to 2015, whereas ours only goes to April of 2020. This is why Investment grade bonds, represented by Bloomberg Agg, are a little positive as opposed to our chart that shows them as negative. (2022 is still having a lasting effect on traditional Fixed Income.) Two most important items:
Private Credit represented by the Cliffwater Direct Lending Index (CDLI) offers higher returns and lower risk than many traditional fixed income options. Alternatives can certainly enhance returns and lower risk/volatility. Important to note the CDLI seeks to measure the unlevered, gross of fees performance of U.S. middle market corporate loans, as represented by the underlying assets of Business Development Companies (“BDCs”), including both exchange-traded and unlisted BDCs, subject to certain eligibility criteria. This issue poses a significant challenge when comparing returns on a gross-of-fees basis. The reported 8.5% return of Private Credit above does not factor in the average fees of 1.5% to 2% charged by BDCs. Therefore, the actual net return to consider is closer to 6.5% to 7%. BDC’s also use leverage at a 2/1 ratio. By taking the leverage out of the equation you have most definitely lowered the volatility of the index. If you adjust for fees and leverage, I am sure this index is still providing more return for the risk taken than the other instruments listed but will not stand out as much as it does on this chart.
Since inception the Kirkland Income Fund has used no leverage and all our reported numbers are net of fees. As of the end of August 2024, our annualized return on the portfolio is 10.24% with a standard deviation of 0.42%, which means over 4 years, our annualized returns have changed by just 42 basis points (bps) from the average annualized return. This indicates very low volatility. Alternative investments and in particular private debt can enhance your returns and lower portfolio risk, but alternative investments that operate in an inefficient space even in comparison to other providers of private debt clearly makes a big difference! This is one of the few times I have seen opportunities for smaller investors, have an opportunity to outperform the big money!
Inflation and Rates
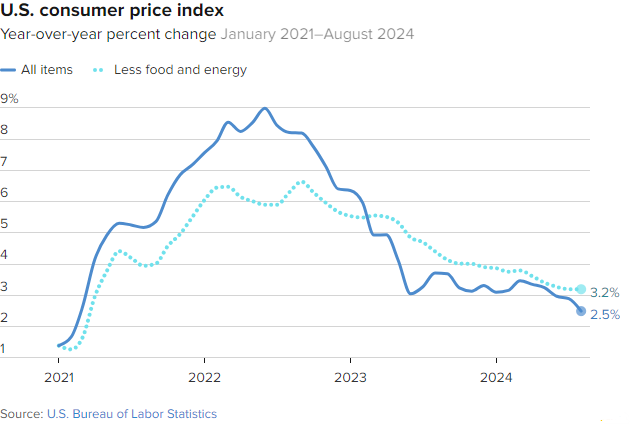
Given that this is at the forefront of many people's minds, I will provide the most recent figures, and it seems that we are still set to see a reduction from the Federal Reserve within September. It seems there is a growing belief we will see 25 bps rather than 50 bps as there are still some concerns in the CPI numbers. In particular the costs of shelter is not flattening and was up 5% in August. CPI is still trending in the “right” direction. August CPI was up 2.5% compared to July’s 2.9%.
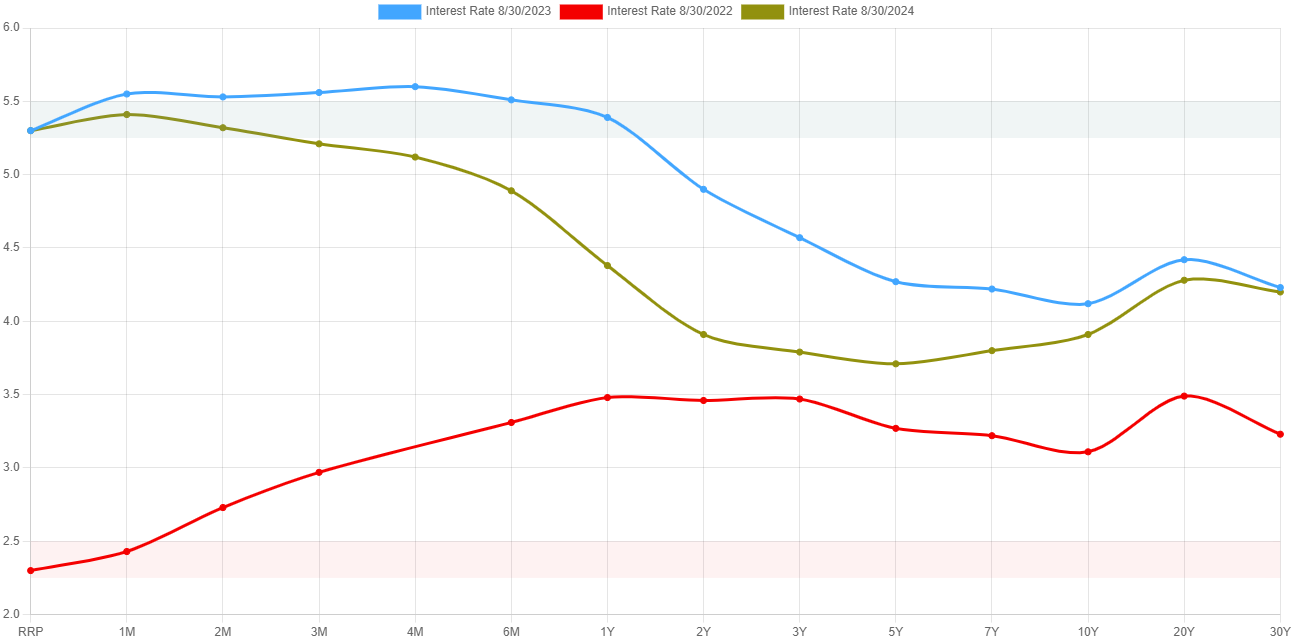
Below is the Treasury yield curve for the years 2022, 2023, 2024 ending August 30th. This chart shows interest rates across different maturities (X-axis) for three dates, with the X-axis representing term lengths (e.g., 1 month, 1 year, 10 years) and the Y-axis indicating interest rates. Higher rates for longer maturities suggest a normal yield curve, while downward slopes point to an inverted curve. Even with a Fed ease in short term rates, we are still looking at an inverted curve–shorter-dated Treasuries yielding more than longer-dated Treasuries. We have been in this position for quite a while now, and we haven't slipped into a recession yet. Therefore, I'm not entirely convinced that an inverted yield curve will be as reliable an indicator of recession this time around. Interesting point on the 2024 line is the 2 year and the 10 year are both at 3.91%, indicating a slight flattening in the curve. Generally, this is an indicator of lower future inflation. Time will tell.
When you have any questions about the newsletter or the Kirkland Income Fund, please do not hesitate to reply or book a call with me.
