
October 2025 Newsletter
October brought a mix of easing monetary policy and persistent inflation pressures. The Federal Reserve (“The Fed”) cut rates for the second consecutive month, signaling a pivot toward a more supportive monetary policy in response to weakening labor conditions. Meanwhile, real estate fundamentals showed early signs of stress in oversupplied markets, even as coastal metros held firm.
The guiding question for this month is: How do short-term economic headwinds shape long-term income strategies for private credit investors?
In this newsletter, we examine key economic developments and their implications, real estate market performance and emerging risks, and how the Kirkland Income Fund (KIF) positions for resilience while navigating regulatory changes.
Economic Overview
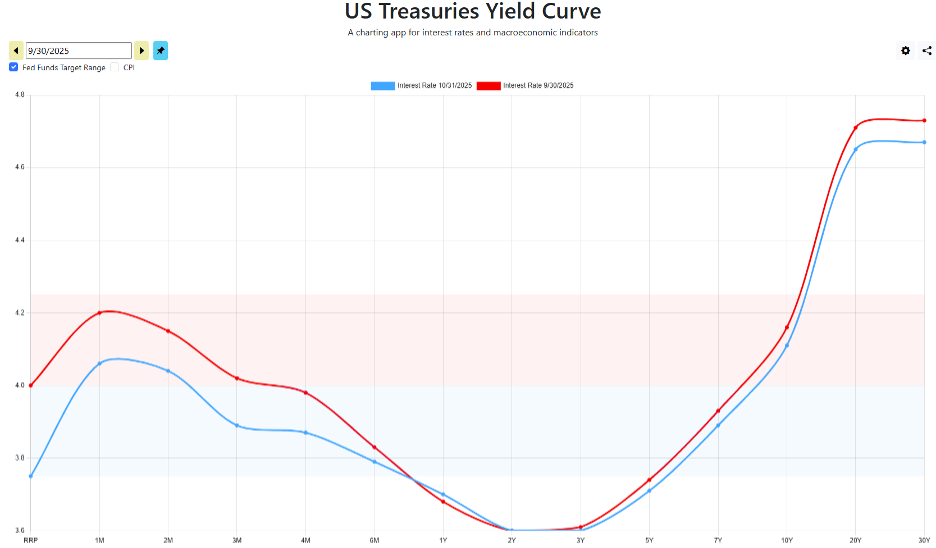
October was marked by a 25 basis point rate cut from the Federal Reserve, bringing the target range to 3.75–4.00 percent as policymakers responded to labor softness. Treasury yields fell slightly, and equity markets rallied, but consumer savings dipped to a year-low, signaling caution ahead.
The 10-year Treasury yield closed at 4.11 percent, down from 4.16 percent at the end of last month.
Official inflation information for September and October is estimated to be released in November. The estimate for September is 3.0% year-over-year, and October is little changed at 2.96% year-over-year. Energy, Food and Shelter, and goods affected by increased tariffs such as furniture, appliance, and vehicles were the drivers of inflation.
Official US employment data is still not available due to the record 43 day federal government shutdown. Goldman Sachs research has estimated that non-farm payrolls declined by about 50,000 jobs. Dow Jones survey is estimating the unemployment rate has risen to 4.5% from the last recorded government number of 4.3% in August.
Equity markets posted gains, with the S&P 500 up 2.34 percent and the Nasdaq up 4.72 percent for the month, mainly driven by perceived value that AI will provide in the future to companies’ bottom line.
The Fed’s pivot suggests a softening growth outlook. Lower yields support credit markets, but labor weakness and tariff-driven inflation continue to create a mixed backdrop and uncertainty of direction. Historically, consecutive rate cuts often precede slower GDP growth, though not always a recession. For investors, the most prudent course is to remain calm and assess risk and exposure in your portfolio.
Real Estate Market Impact
Multifamily is mixed by geography overall; rents fell 0.3 percent month-over-month to $1,708, marking the steepest October decline in 15 years. Occupancy eased to 94.7 percent, still historically strong but trending downward. Sun Belt markets such as Austin and Denver are under pressure from oversupply causing declines of 4.6 percent and 3.7 percent respectively. Coastal metros like San Francisco and Chicago outperformed expectations.
Retail remains resilient, with strong tenant demand in discount and health sectors, though tariffs and e-commerce continue to weigh on margins. There is a wave of older spaces being refurbished and repurposed.
Hospitality performance weakened, with RevPAR down 0.1 percent year-to-date and sharp year-over-year declines in Houston and Las Vegas of 25 percent and 10 percent respectively. Operating costs are outpacing revenue growth, compressing margins, and the government shutdown has added uncertainty to travel demand.
Office sector remains challenged, with national vacancy at 18.6%, still historically high despite a slight year-over-year improvement. Asking rents averaged $32.79 per square foot, down 0.3% from last year. Demand continues to lag pre-pandemic levels by roughly 30%, driven by hybrid work and tenant flight to quality. There are pockets of strength based on class of property and geographical location. High classes are showing strength while older properties struggle. Co-working and flexible space models are gaining traction as companies seek adaptability.
Industrial real estate continues to outperform, with net absorption hitting 45.1 million square feet in Q3, a 30% quarter-over-quarter increase. Year-to-date absorption reached 108 million square feet, nearly matching 2024 levels. Vacancy held at 7.1%, slightly above pre-pandemic norms, while asking rents averaged $10.10 per square foot, up 1.7% year-over-year. Demand is concentrated in modern facilities, while older assets see negative absorption.
Source: Cushman & Wakefield & JLL.
CRE Defaults Announcements and Rates
The big news in October was several high-profile corporate loan defaults came to light, triggering significant losses for both large and regional banks. The most notable bankruptcies were those of Tricolor, a subprime auto lender, and First Brands, an auto parts supplier. These defaults led to direct losses for major institutions including Jefferies and JP Morgan. Shortly after, regional banks such as Zions Bank and Western Alliance announced negative credit events tied to their warehouse lending facilities for commercial real estate (CRE) debt funds managed by Cantor Group. Allegations surfaced that Cantor Group had transferred collateral backing these facilities to other entities, raising concerns about misrepresentation and possible fraud.
Importantly, these defaults and credit events were not driven by broader economic weakness or declining collateral values in CRE portfolios, but rather by alleged misrepresentation and fraudulent activities. As a result, the direct fallout for the CRE market is expected to be limited. However, it is a reminder to investors, just as we saw in YieldStreet’s announcement, that stressful markets are causing shops to cut corners and misrepresent the facts. Always be diligent and be sure your questions are being answered and you understand how the managers are earning their returns.
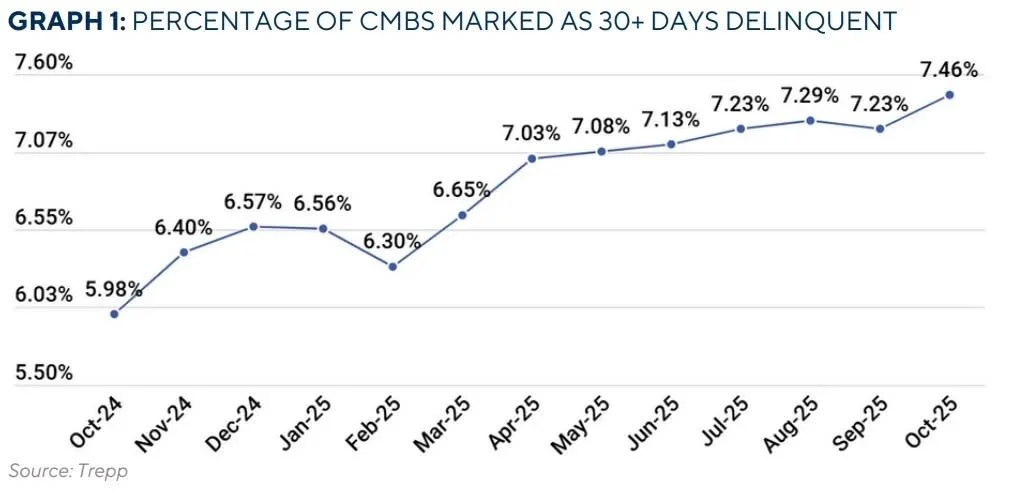
This year has seen steady pressure on private debt. One metric that we have continued to follow is the CMBS delinquency rate as an indicator of the broad CRE market space. In October the rate increased 23 bps to a new high of 7.46%. This index was led by office space that increased by 63 bps to a new high of 11.76% delinquent. Multifamily rose 53 bps to 7.12%. According to Trepp, this is the first time multifamily went above 7% in over a decade. As can be seen in the chart below, the rate of loans that are delinquent continues to rise in 2025.
For the Kirkland Income Fund we have seen rising and falling NPL levels throughout this year but there are still multiple issues causing stress in the marketplace. We have solved a number of NPLs this year and continue to resolve these loans without a write off. In some cases, it takes an in-person visit and a discussion with the borrower as Brock did by heading to Florida to work out next steps on a loan in Canal Point. We will continue to be proactive and very risk averse as to limit exposure in this stressful time.
What This Means for the Kirkland Income Fund (KIF)
KIF has always had conservative underwriting and remains a cornerstone of its strategy. We have continuously refined our underwriting process in response to evolving market conditions, ensuring our strategies remain resilient and adaptive amid ongoing volatility.
The portfolio remains conservatively positioned, with a current “as-is” loan-to-value ratio of just 61 percent—calculated using present property valuations rather than speculative future projections. This disciplined approach helps insulate the fund from market volatility and supports long-term capital preservation.
Average maturity is currently 7 months but is expected to increase slightly as we head to the end of the year. Slower deal flow has weighed on portfolio performance for much of the year. However, several high-quality loans are now entering final underwriting, which is expected to increase average maturity and enhance overall portfolio returns.
The addition of new team members and the advancement of our processes and procedures are accelerating the resolution of non-performing loans. Multiple loans are in the queue to be cured in the next few months. As these loans progress, we will look forward to providing a thorough update.
Despite ongoing market uncertainties, our proactive approach positions us to return the fund to its historically strong utilization rates and returns.
Regulation Updates
BASEL
With Basel III Endgame proposals under review, banks are proactively adjusting their lending practices in anticipation of higher capital requirements—opening the door for private credit funds to capture greater market share.
REITS and the One Big Beautiful Act (OBBA)
OBBA’s biggest impact is on structures like Real Estate Investment Trusts (REITs) and SubREITs. Normally, most investment entities, including LLCs and limited partnerships—face strict income limits on how much of this deduction high-earning investors can claim. These limits increased in 2025 to about $394,600 for joint filers and $197,300 for single filers, meaning investors earning above these amounts see their deduction reduced or phased out.
However, if you invest through a REIT or SubREIT, you get a major advantage: dividends paid by REITs are not affected by these income caps. Whether your income is above or below the threshold, you can still claim the full 20% deduction on REIT dividends. SubREIT structures also give fund managers more flexibility to handle income that might not qualify for the deduction, thanks to the ability to use Taxable REIT subsidiaries (TRS) to strategically manage these revenues. In short, investing via REIT or SubREIT not only maximizes your tax efficiency but also ensures compliance, helping you retain more of your returns regardless of income level.
For those looking to enhance tax efficiency and maximize after-tax returns, REIT and SubREIT investments are now more compelling than ever.
Additional Resource: Understanding the Advantages of the Kirkland Income Fund Sub-REIT
2025 SEC Guidance: What Investors Should Know About Rule 506(c) Verification
The SEC recently released important guidance for investors interested in funds offered under Rule 506(c). In 2025, the SEC staff issued a no-action letter clarifying how fund managers can satisfy the requirement to take “reasonable steps” to verify that investors qualify as accredited.
Here’s what this means for you as an investor:
Minimum Investment Thresholds: If you invest at least $200,000 (as an individual) or $1,000,000 (as a legal entity) into the fund, the fund manager can use this minimum investment amount as a valid way to verify your accredited status.
Written Confirmation: You’ll need to provide a written statement confirming that you are an accredited investor and that you did not use third-party financing for your investment.
No Contrary Evidence: The fund manager must not have any actual knowledge or evidence indicating that you aren’t accredited or that your investment was improperly financed.
This updated SEC guidance streamlines the process for qualifying as an accredited investor, making it easier for investors who meet the minimum investment thresholds and provide the required written confirmations. It also clarifies fund managers’ responsibilities, ensuring greater transparency and compliance in Rule 506(c) offerings. If you’re considering investing in such funds, these changes may simplify your verification process and help you understand what’s expected when participating in private offerings.
Investor Questions Answered
Question: “How does the Fed’s rate cut affect my income returns?”
Answer: For our micro-balance bridge loans in commercial real estate (CRE), short-term rate cuts—including those affecting the 10-year Treasury—have minimal immediate impact on the rates we offer. Our lending space is shaped by a variety of supply and demand factors, with recent trends showing increased caution among CRE investors due to recession fears and risk aversion—even in smaller property transactions.
In the last quarter, we saw an uptick in borrowers securing finance for quality deals, thanks to modest rate reductions—allowing us to deploy capital into stronger opportunities. With the influx of borrowers with robust credit and substantial supporting assets, and the willingness to borrow with conservative LTVs, we are able to increase fund utilization and lower the default risk of the portfolio. Our rates are also less sensitive to public market fluctuations, offering investors a more stable return profile.
