
May 2026 Newsletter
May extended, rather than resolved, the tension that has defined this year. Inflation reaccelerated to a three-year high, driven largely by an energy shock the Federal Reserve cannot fix with interest rates. The labor market stayed firm, equities pressed to new records, and the Fed's policy rate held steady as leadership passed to a new Chair. Beneath those headlines, private credit stress deepened and a large wave of commercial real estate loans moved closer to a refinancing test that will define the next several quarters.
Public markets are pricing relief. Credit markets are pricing reality. The question this month is whether a portfolio is positioned for the version of the economy that headline indices see, or the version that maturing loans are seeing.
In this month's update, we examine how May's reaccelerating inflation, a Fed holding steady under new leadership, firm labor data, and a deepening commercial real estate refinancing wall are shaping the lending environment. We also explain why bridge lending discipline matters more in a transitional market, and answer a timely investor question about deploying capital when rates stay elevated.
Economic Overview
Inflation: The Energy Shock Pushes Prices Higher
The May Consumer Price Index, released June 10, showed headline inflation of 0.5% for the month and 4.2% year over year, the fastest annual pace since April 2023 and up from 3.8% in April. Core CPI, which excludes food and energy, rose 0.2% for the month and 2.9% year over year. (BLS)
The distinction matters. Much of the monthly increase came from energy, tied to the continued disruption around the Strait of Hormuz. This is supply-driven inflation. It originates in the cost of moving oil, not in overheating domestic demand, which is why higher interest rates do little to address it. For credit markets, the practical conclusion is that the path to lower policy rates has become longer and less certain than the consensus expected entering the year.
Employment: Firm Headline, Flat Real Wages
May nonfarm payrolls rose by 172,000, well above the consensus near 80,000, though down slightly from April's upwardly revised 179,000. The unemployment rate held at 4.3% for a fourth consecutive month. Average hourly earnings rose 0.3% for the month and 3.4% year over year. (BLS)
The headline reads as strength, and on the surface it is. The more useful observation is that wage growth of 3.4% is now running below headline inflation of 4.2%. Real wages are roughly flat to slightly negative. For real estate, this matters because wage growth drives household formation, retail spending, and travel demand, which are the cash-flow engines of most property types.
Federal Reserve: A New Chair Holds the Line
There was no FOMC meeting in May. The federal funds rate remains at 3.50% to 3.75%, following the April hold that Jerome Powell chaired before his term ended in mid-May. Kevin Warsh, confirmed by the Senate on May 13, now leads the Committee, and the June 16–17 meeting will be the first of his tenure. Futures markets were pricing better than 99% odds of no change at that meeting, with year-end hike probabilities near 40% and no rate cuts priced for 2026. (CME FedWatch)
Rates were held because the current inflation pressure is supply-driven, and raising rates does not lower the price of oil. A central bank facing that kind of shock tends to wait rather than act. The early signals from the new regime point toward less forward guidance and a firm focus on price stability. From our perspective, the base case is a prolonged hold, with the risk skewed toward higher-for-longer rather than relief.
Yield Curve and Treasury Markets
Treasury yields continued to grind higher across the curve in May, with the front end leading as markets priced out cuts:
| Maturity | May 29, 2026 | Apr 29, 2026 | Monthly Change |
|---|---|---|---|
| 2-Year | 4.00% | 3.88% | +12 bps |
| 5-Year | 4.17% | 4.02% | +15 bps |
| 10-Year | 4.48% | 4.39% | +9 bps |
| 30-Year | 5.01% | 4.94% | +7 bps |
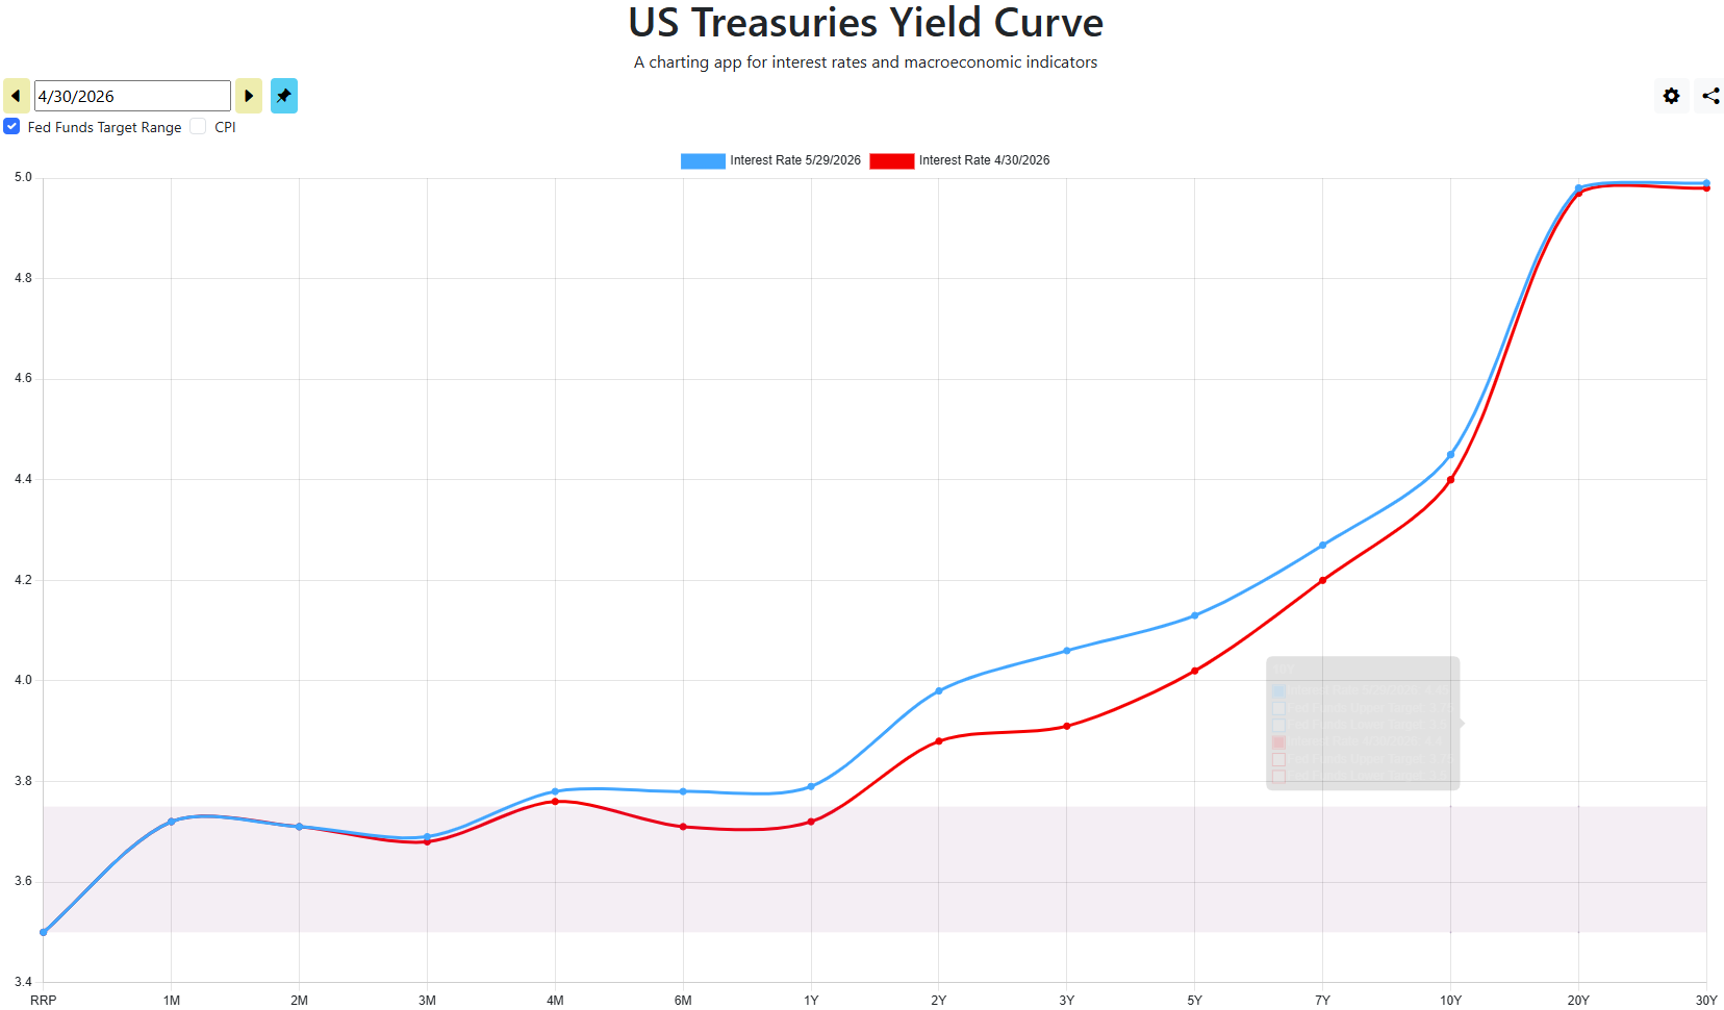
The 10-year less 2-year spread stood near +48 basis points, positive and well clear of the recession-signaling inversion seen in prior periods. The message is consistent: markets have moved from pricing easing to pricing a prolonged plateau, with rates restrictive relative to the past decade and the curve awaiting clearer direction from the new Chair.
Equity and Fixed Income Markets
Public markets extended April's relief rally. The S&P 500 returned 5.26% on a total-return basis in May, building on April's record and pressing to new highs, with the VIX easing to roughly 15.3. REITs and bonds lagged equities:
| Index | May 2026 | 2026 YTD |
|---|---|---|
| S&P 500 (Total Return) | +5.26% | +11.27% |
| MSCI U.S. REIT | -0.35% | +12.63% |
| U.S. Corporate Bonds | +0.97% | +0.78% |
| U.S. Treasuries | +0.09% | +0.14% |
What This Means for Investors
Several forces are operating at once: a supply-driven inflation re-acceleration, a Fed on hold, yields grinding higher, and equities pricing optimism. This kind of middle environment creates selective stress rather than broad-based distress. Transitional real estate and over-levered borrowers feel the most pressure, while stabilized assets with durable cash flow hold up.
JPMorgan's latest outlook frames the broader backdrop as one of rolling shocks, a setting in which a traditional 60/40 stock-and-bond mix can be pressured on both sides at once. That backdrop rewards strategies with documented collateral value, shorter duration, and income that does not depend on market direction to be realized. It is, in short, the case for treating short-duration real estate credit as a distinct allocation within fixed income rather than an afterthought to it.
Be on the lookout for our webinar, where I discuss the impact of alternative fixed income on a 60/40 portfolio.
Real Estate Market Impact
May's macro mix continued to translate unevenly into real estate. For lenders writing new business today, the underwriting environment is materially better than it was three years ago. For servicers and equity holders facing the legacy book, the picture is the opposite.
Multifamily: Demand Holds, Pricing Power Soft
National asking rents rose just 0.2% year over year in May to $1,767. CoStar raised its year-end 2026 vacancy forecast to 8.8%. (Yardi Matrix; CoStar) Operators are prioritizing occupancy over rent growth. A 30-year fixed mortgage near 6.53% (Freddie Mac) keeps would-be buyers renting, which puts a floor under demand even as pricing power softens.
Retail: Tightest Major Sector, Consumer the Key Variable
Vacancy tightened to 5.40% in May, 110 basis points tighter year over year, with landlords holding pricing power as structural supply constraints limit new development. (Crexi) Necessity-based formats remain the strongest collateral in the sector; discretionary tenants are under pressure from energy-driven consumer spending softness. CMBS retail delinquency rose 30 basis points to 6.61%, concentrated in regional malls; special servicing edged up to 13.00%, with the elevated rate weighted toward legacy CMBS vintages. (Trepp)
Hospitality: Strongest Improvement of Any Sector
CoStar and Tourism Economics revised the full-year U.S. RevPAR forecast to +2.8% year over year, with demand growth of 3.2% outpacing supply growth of 2.3%. (CoStar/Tourism Economics, June 2026) The Strait of Hormuz deal in June could remove the energy cost headwind that compressed operating margins since March, with domestic travel and the World Cup adding near-term demand. CMBS lodging delinquency fell 51 basis points to 6.01% and special servicing posted the largest sector improvement of any property type, falling 121 basis points to 8.45%. (Trepp)
Industrial: Large Format Tightening, Mid-Size Still Digesting
Demand from large logistics occupiers (above 500,000 square feet) has driven vacancy compression in that segment, while mid-size and smaller warehouses continue working through supply — vacancy for new logistics properties is at its highest since 2006 except for the largest format. (CoStar, June 16, 2026) Average lease terms have compressed from seven years to five years as tenants favor flexibility, a signal of continued uncertainty in supply chain and trade planning. CMBS industrial delinquency rose 35 basis points to 1.31%; special servicing edged up five basis points to 1.28% — still the lowest readings across all major property types. (Trepp)
Commercial Real Estate Distress and the Refinancing Wall
The Trepp CMBS delinquency rate held at 7.55% in May, essentially flat for the month, with wide variation by property type: office 11.53%, multifamily 6.95%, retail 6.61%, lodging 6.01%, and industrial 1.31%. A separate measure from CRED iQ put distress across the top 25 metros at 12.7%, up from 12.2% a year ago. (Trepp; CRED iQ)
The larger story is the maturity wall. The Mortgage Bankers Association estimates roughly $875 billion to $936 billion of commercial real estate loans mature in 2026, with multifamily maturities up about 56% to roughly $162 billion. New commercial real estate loans are being written near 6.24%, against a legacy book closer to 4.76%. (MBA) The central question is no longer the direction of rates or the amount of debt coming due. It is who can refinance on acceptable terms and who cannot.
Current Events
The Energy Shock Eases but Does Not Resolve
The conflict that drove March's record oil spike has now run roughly 100 days, with global crude supply down an estimated 14%. (CNBC) Prices eased through May, with Brent near $92 at month-end, off the earlier peak near $105 but still above the pre-conflict baseline. Markets were treating the situation as resolved, but events have shifted in the Middle East once again. Higher energy costs still raise operating expenses across every property type and weigh on the consumer spending that supports retail and hospitality cash flows.
The Private Credit Stress Is Concentrated, Not Systemic
It is important to distinguish between the segments behind headline private credit stress. As JPMorgan noted in its latest outlook, this stress is concentrated in software and corporate credit and is not, in their assessment, systemic across other sectors of private debt. These loans are also placed in semi-liquid fund structures which naturally create a mismatch against illiquid underlying loans, where redemption demand cannot always be met.
Looking Ahead
The U.S.-Iran deal signed in June and the reopening of the Strait of Hormuz change the forward trajectory of the energy story that defined May. If the resolution holds, the energy contribution to CPI that drove the May reacceleration to 4.2% should moderate, giving the Fed more room to hold without the pressure of supply-driven inflation. For real estate, easing energy costs reduce operating pressure on hospitality, industrial, and retail assets simultaneously. The path for the second half of 2026 looks materially different from the path May suggested, which is precisely why short duration and current-conditions underwriting matter more than macro timing.
Educational Insight: Bridge Lending in a Transitional Market
Bridge lending continues to play a central role in real estate, but the context in which it is used has shifted. It is worth defining the term and explaining where the risk actually sits.
A bridge loan is short-term real estate financing used to carry a property through a transition period until a more permanent outcome is available. That outcome may be a sale, a refinance into bank, agency, CMBS, life company, or other permanent debt, the completion of a lease-up or renovation program, or the resolution of a timing gap that prevents conventional financing today.
Bridge lending spans a wide range of structures. Loans may be first-lien or mezzanine, recourse or non-recourse, floating- or fixed-rate, and may be underwritten to current cash flow, in-place value, cost, or a credible business plan. They are commonly used for acquisitions, value-add executions, lease-up, recapitalizations, partner buyouts, discounted payoffs, and refinancing extensions when existing debt matures before a property is fully stabilized.
Because bridge lending is a category rather than a single formula, risk varies materially by asset type, leverage, sponsorship, business plan complexity, reserve structure, and exit strategy. Some bridge loans are conservative and primarily solve for time. Others take on meaningful execution risk by funding renovation, carrying weak occupancy, or relying on future market improvement. In all cases, the core question is whether the capital structure gives the borrower enough time and flexibility to complete the transition without leaving the lender overly dependent on best-case assumptions.
The takeaway for investors is that bridge lending should be evaluated loan by loan and lender by lender. Headline yield alone says very little. More important are where the lender sits in the capital stack, how leverage is measured, what assumptions support the exit, whether interest and capital needs are adequately reserved, how much business-plan risk remains, and how the lender manages downside scenarios if the transition takes longer than expected. Across all forms of bridge lending, structure is what determines whether the strategy preserves capital or magnifies risk.
We have covered bridge lending in depth in our Bridge Lending 101 primer. Read it here.
What This Means for Kirkland Income Fund Investors
Capital Preservation Without Having to Time the Cycle
The Fund's investors are not in the business of calling the market, and the structure is built so they do not have to. The weighted-average loan-to-value held near 57.6% in May on as-is value, leaving roughly 42 cents of borrower equity ahead of every dollar of investor capital across 59 first-lien loans and approximately $37.9 million deployed. Because the Fund lends on transitional assets that banks will not yet finance, that equity cushion is the first line of defense, and it does not loosen as market conditions shift.
Conservative Underwriting as Protection
This month's record private-credit default rate is a corporate-credit story, and the reason it does not read across to a real-estate-secured book is underwriting. The Fund sizes each loan to a property's as-is value, not to a stabilized projection, so the cushion that absorbs cap-rate movement, rent softness, and operating-cost pressure is set at origination rather than assumed. That is what separates the Kirkland Income Fund's exposures from the corporate defaults and the CMBS maturity wall now drawing headlines. Loans are first-lien with full recourse, diversified across property types and geography, with no raw land or ground-up construction.
Short Duration Limits Exposure
This is where the maturity wall matters most. The 2021 and 2022 loan vintages are now coming due at valuations and rates that have moved against them, the core of the refinancing problem across the market. The Fund's weighted-average maturity of roughly 7.2 months turns that risk on its head: the book reprices into current conditions as each loan matures rather than sitting trapped under yesterday's rate. The same short duration also distinguishes the Fund from the large private credit vehicles whose illiquid, multiyear assets cannot keep pace with redemption demand. Short duration here is a risk-management tool, not just a feature.
A Disciplined Approach
Discipline shows up as the deals the Fund passes on, and that gets harder when capital is plentiful and looser terms circulate among private lenders. During May, the Fund declined several requests for higher leverage or rent-growth assumptions inconsistent with current data. Passing on loans can slow near-term deployment, but it protects the portfolio rather than chasing volume on weaker terms. Defaults remain an operational reality of lending and have not translated into realized losses to date, due in part to the Fund’s no-leverage structure, as-is valuation, and first-lien positioning, which help mitigate individual loan stress.
Investor Question
Question: If interest rates remain elevated, why deploy capital now instead of waiting for a more favorable entry point?
Answer: The question assumes that the best opportunities arrive after conditions normalize. In short-duration real estate credit, the opposite is often true. Today's most attractive loans exist precisely because borrowers face near-term constraints: a loan coming due, a property still in transition that a bank will not yet finance, or a valuation that no longer supports the original financing. Those constraints are the source of both yield and lender leverage on terms.
By holding short duration and focusing on income-generating loans secured by current as-is value, the Fund captures today's pricing while retaining the flexibility to re-underwrite as conditions change. Waiting for clarity usually means competing later in a more crowded and efficiently priced market. The takeaway: in this environment, disciplined deployment into market dislocations is more durable than waiting for a normalization that minimizes inefficiency and opportunity.
With regard to building a better portfolio, alternative debt should be viewed as a structural component of a well-constructed portfolio, not a tactical allocation that depends on calling the rate cycle correctly. Its role is to provide current income, shorter duration, and asset-backed downside protection that can complement both traditional fixed income and equity exposure across a range of market environments.
For that reason, the case for investing in alternative debt is strongest when it is treated as an enduring allocation to a portfolio and not as an opportunistic trade. Attempting to time entry often results in sitting in cash while income is forfeited and attractive loan vintages are missed. A more durable approach is to maintain disciplined exposure through cycles, allowing the portfolio to benefit from recurring yield, enhanced selectivity in dislocated periods, and capital preservation features that are often difficult to replicate in public markets.
