
April 2026 Newsletter
April was a recalibration month. The energy shock that defined March began to retrace as a ceasefire was announced late in the month, oil pulled back from peak but remained elevated, and equity markets staged a sharp relief rally that pushed the S&P 500 to a new all-time high on April 30. Beneath the surface, however, the picture darkened in places that matter for credit.
Public markets are pricing relief; credit markets are pricing reality. The question this month is whether your portfolio is positioned for the version of the economy that headline indices see, or the version that maturing loans are seeing.
In this month’s update, we examine how April’s 3.8% inflation reacceleration, a divided Fed, a cooling labor market, and record multifamily CMBS delinquencies are affecting the lending environment. We also explain why underwriting to As-Is value remains a core discipline in private real estate credit and answer a timely investor question on why third-party administrators and independent auditors are non-negotiables when evaluating a fund.
Economic Overview
Inflation
The April 2026 CPI release confirmed what tariff-driven components had been telegraphing throughout the quarter: inflation reaccelerated. Headline CPI rose 3.8% year-over-year, the highest reading since May 2023, and increased 0.6% month-over-month. Core CPI came in at 2.8% year-over-year and 0.4% month-over-month.
The April print is notable because it arrived even as oil partially unwound from its March peak. Energy was still up +17.9% year-over-year (gasoline +28.4%); shelter (+2.8%) and food (+3.2%) remained sticky, services held firm, and tariff pass-through appears to be a growing contributor.
Employment
April non-farm payrolls came in at +115,000, a meaningful step down from March's pace and modestly above the consensus expectation of roughly +62,000. The unemployment rate held at 4.3% for a third consecutive month. Average hourly earnings rose 3.5% year-over-year, the slowest pace in nearly four years.
The post announcement revisions tell the bigger story. March payrolls were revised up to +185,000, but February was revised down to a net loss of approximately 156,000 jobs. The two-month trailing average through April fell to roughly +85,000, and the three-month average is now under +100,000 for the first time since 2020. Healthcare and government accounted for most of April's gains; cyclical sectors including manufacturing, transportation, and retail trade were flat to negative.
Federal Reserve
The FOMC held the federal funds rate at 3.50 to 3.75% at its April 29 meeting, the third consecutive hold. Four members dissented, the highest count since October 1992. The Committee is no longer aligned on direction.
In January, the dot plot showed a median of two to three cuts in 2026. By April's meeting, the market had moved to zero, and Federal Reserve communication had shifted from "data dependent" to something closer to "data divided."
Powell has stepped down and Kevin Warsh is the Fed Chairman. Things to watch for in this new regime:
Less communication and guidance
Change in measurement (Core)
Targeting a shrinking federal balance sheet
Focus on price stability (Potentially ending the “Fed Put”)
Yield Curve and Treasury Markets
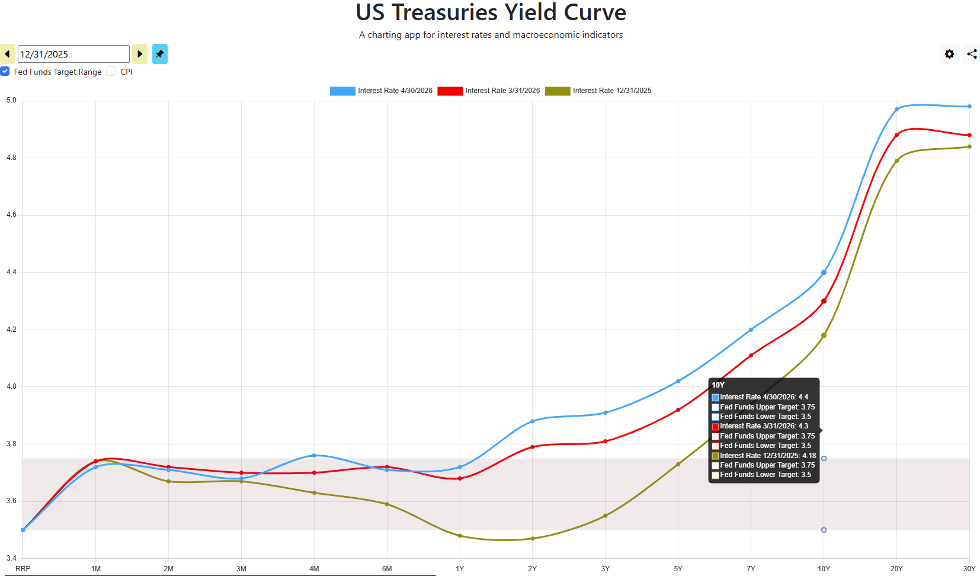
The 2-year closed April at 3.88% and the 10-year at 4.39%, with the long end retaining steepness, a signal that the market is still pricing forward risk. Moves month-to-month have been mild, ranging from 5 to 10 bps across the curve but in a consistently higher fashion since the beginning of the year. Curve is digesting the global macro events and waiting to obtain more clarity from the new Fed Chairman. No sign of recession but also no strong signs of growth.
|
Equity Markets
April produced one of the sharpest monthly equity rallies of the cycle. The S&P 500 Total Return Index rose 10.49% on the back of the Iran ceasefire and partial energy retracement, closing at a new all-time high of 7,162.40 on April 30. The MSCI U.S. REIT Index gained 8.89%. The Bloomberg US Aggregate Bond Index returned 0.43% as the long end of the curve stabilized. The VIX settled back into the high teens after topping 30 during March. A key concern: earnings have not moved meaningfully.
What This Means for Investors
April redistributed risk across asset classes rather than changing the underlying picture. Public markets priced relief; credit markets continued to price risk. The combination of a divided Fed, confirmed inflation re-acceleration, a cooling labor market, and a record multifamily CMBS delinquency rate points to an environment lacking directional commitment. This middle environment tends to create selective stress rather than broad‑based distress. Transitional real estate, over‑levered borrowers, and assets with deferred capex are feeling the most pressure. Stabilized assets with strong cash flow are holding up well.
This environment supports the case for short‑duration allowing flexibility for repricing as conditions evolve.
One additional data point from early May: the Federal Reserve's April 2026 Senior Loan Officer Opinion Survey, covering Q1 2026 lending conditions, reported that banks left CRE lending standards basically unchanged for the quarter, the first period without material net tightening after two consecutive years of increases. Has the phase of bank retrenchment stabilized? It is too early to say but, standards remain restrictive relative to 2019 and 2020 levels, and the structural pressure from pending Basel III capital requirements is unlikely to reverse that trend. But for private lenders, the tailwind from bank retrenchment may moderate as competition gradually returns to certain borrower segments. For the Kirkland Income Fund, this is ideal as it is paramount that we have continued bank and credit union involvement in the exits of portfolio loans.
Real Estate Market Impact
April's macro mix continued to translate unevenly into real estate behavior.
For lenders writing new business today, the underwriting environment is materially better than it was three years ago. For servicers and equity holders facing the legacy book, the picture is the opposite.
Multifamily
Rent growth has slowed nationally, ranging from -0.2% YoY according to Yardi to -1.7% YoY according to Realtor.com. Growth rates remain highly location dependent. Large markets still absorbing new supply like Phoenix, Austin, and Atlanta have seen concessions return, pulling down the national average. There are many zombie properties yet to fall as borrowers with floating‑rate debt continue to feel pressure, especially those who underwrote 2021–2022 rent growth assumptions that never materialized.
Increasing duration with no discernible path is not alleviating the pressure felt in many areas of multifamily.
Retail
Neighborhood retail remains resilient, with national occupancy at 94%. Essentials‑based tenants continue to drive stability. Borrowers in this segment are generally performing well, though refinancing remains challenging due to higher debt service requirements. Retail rent growth led all CRE sectors nationally in April at +4.7% YoY.
Hospitality
Hospitality remains the most cyclically sensitive property type, with operating margins directly exposed to energy costs and travel demand directly exposed to consumer sentiment, which sat at a record low for the month.
Drive‑to-leisure markets remain strong, while urban business travel is still below 2019 levels. Borrowers with older assets requiring capex are facing the toughest conditions, as construction costs remain elevated. RevPAR growth was 4.5% YoY according to HVS with luxury leading the growth.
Office
Office CMBS delinquency edged down 2 basis points to 11.69% in April, the first monthly decline in nearly half a year. A 2-basis-point move at this level does not signal improvement. Office still represents roughly a third of the April hard maturity cohort, and the structural vacancy story is unchanged.
Current Events
Iran Ceasefire
A ceasefire was announced in late April, easing the active conflict that had begun February 28. The US blockade of Iranian ports remains in place, and Brent crude held near $111 per barrel through month-end, well off the March peak but still above the pre-conflict baseline. Energy costs across construction, operations, and consumer spending have eased from peak levels but have not normalized. Insurance markets for shipping through the Strait of Hormuz remain priced for risk. The fragility of the resolution is a tail risk that markets are treating as resolved but lenders should not.
Private Credit Fundraising Continues to Surge
Despite the redemption stress that dominated headlines in February and March, capital continued to flow into private credit. A single week in April (April 8 to 15) saw approximately $45 billion in mega-fund capital announced, including Blackstone Opportunistic Credit Fund V ($10 billion), Bain Capital new commitments ($8 billion), Dawson Partners flagship close ($7.7 billion), and a Pimco data center debt package ($14 billion).
This is not bearish for the asset class. It is a concentration signal. The same vehicles that gated retail redemptions earlier this year are the vehicles attracting the largest new commitments, and pricing competition at the top of the market is intensifying just as the underlying credit environment softens.
Educational Insight
What "As-Is" Actually Means
As-Is value is the current market value of a property based on its actual income, actual occupancy, and actual condition today. It is what a knowledgeable buyer would pay on the open market right now, not after the renovation is complete, not after the lease-up reaches stabilized occupancy, and not after assumed rent growth recovers.
The counterpart is pro forma valuation or stabilized value: a projection of what the property will be worth once a business plan is executed. Pro forma values require independent assumptions about rent growth, absorption timing, construction costs, and exit cap rates, all of which are variable and all of which can fail simultaneously.
Why "As-Is" Value Matters
In a market where cap rates, rents, and operating expenses are all in flux, underwriting to As-Is value has become one of the most important risk-management disciplines in private credit. It is also one of the most frequently misunderstood, by borrowers who want to argue future value to extract more leverage from a property. As-Is valuation places the lender in a more conservative position and combined with a low LTV creates a large equity cushion to absorb market impacts on property valuation.
The Takeaway for Investors
Three questions worth asking about any private real estate lender:
What value is the loan sized against: current As-Is market value, or a future stabilized or as-completed projection?
If the business plan takes longer or costs more than expected, what happens to the loan-to-value ratio?
Has the lender's underwriting been tested through a full rate cycle, or only through the expansion?
What This Means for Kirkland Income Fund Investors
Capital Preservation Without Having to Time the Cycle
KIF investors are not in the business of calling the market. The fund's weighted average loan-to-value of 58%, anchored to today's As-Is property values rather than projected future worth, means there are 42 cents of borrower equity standing ahead of every dollar of investor capital. That cushion was established at inception in 2020 and has been applied consistently through every rate cycle since.
Conservative Underwriting as Protection
By underwriting to As-Is value rather than pro forma or stabilized projections, KIF avoids the valuation risk that has challenged many lenders over the past two years and will continue to challenge them in 2026. The 58% weighted average LTV is not a marketing number it is the buffer that absorbs the cap-rate movement, rent softness, and operating-cost pressure described earlier in this letter.
Short Duration Limits Exposure
With a seasoned loan book and weighted average duration under 12 months, KIF maintains the ability to reprice risk, adjust structure, and respond to changing borrower conditions as each loan matures. This stands in direct contrast to long-term mortgages originated at lower rates against valuations that have since deteriorated. Short duration is not just a feature it is a risk-management tool that keeps the portfolio current with the market rather than locked into yesterday's assumptions.
Disciplined Approach
Maintaining discipline sometimes means saying no. In April, KIF declined a loan request from a repeat borrower seeking 72% LTV on a transitional multifamily asset with declining occupancy. The borrower had strong credit, but the business plan relied on rent growth assumptions inconsistent with current market data. Passing on this loan preserved the fund's risk profile and reinforced our underwriting standards.
Investor Question
Investor question:"Chris, when you were an allocator, why were two of your non-negotiables that a fund must have a third-party administrator and an auditor?"
Response: At the highest level they act as a great filter. If institutional investors and custodians require this, why shouldn’t you as an investor?
A third‑party fund administrator and an independent auditor protect investors in different but complementary ways.
The administrator provides continuous, real‑time operational controls, independent NAV calculation, cash oversight, capital account maintenance, reconciliations, and fee/waterfall checks which work to prevent many categories of misstatement or misuse before they can occur.
The auditor provides a retrospective, point‑in‑time attestation that the year‑end financials are free of material misstatement.
When used together, they close each other’s gaps: the admin removes the GP’s unilateral control over books and cash, and the auditor validates the admin’s work and the fund’s overall financial integrity.
