
March 2026 Newsletter
March was a month that tested assumptions. The escalation of military conflict in Iran and the closure of the Strait of Hormuz sent oil prices surging by 63%, the largest monthly gain in Brent crude’s history. Equities entered correction territory, Treasury yields rose sharply across the curve, and the Federal Reserve raised its inflation forecast while holding rates steady. Meanwhile, the private credit industry’s liquidity challenges deepened, with several of the largest fund managers capping or halting investor redemptions.
These are not isolated headlines. They are connected forces reshaping how capital flows through credit markets, how borrowers approach refinancing, and how investors evaluate risk. The question this month is not whether volatility has arrived. It has. The question is whether your portfolio was built for it.
In this month’s update, we look at how March’s combination of geopolitical shock, inflation pressure, and structural stress in private credit is affecting real estate lending. We also include an educational section on the private debt landscape, why the headlines about private credit may not mean what you think they mean, and where our strategy fits within it.
Economic Overview
Inflation: Energy Shock Threatens the Disinflation Trend
March’s CPI data, released in early April, reflected the impact of recent geopolitical events: headline CPI surged to 3.9% year-over-year, the highest reading since October 2022, while core CPI increased to 3.2% year-over-year. Shelter inflation continued to moderate, rising just 0.2% month-over-month, but this stability was quickly overshadowed by the sharp rise in energy prices.
The conflict in Iran and subsequent disruptions in energy markets drove March headline CPI significantly higher. Oxford Economics projects that headline inflation may exceed 4% in April as elevated energy costs continue to filter through the broader economy.
This means the disinflation trend seen over the past two years is facing its most formidable challenge yet. While moderating shelter costs offer some relief, the surge in energy prices is likely to continue to outweigh those gains in the headline inflation measure.
For credit markets, the bottom line is that the path to lower interest rates has become longer and more uncertain.
Employment: A Misleading Headline
March nonfarm payrolls came in at +178,000, well above the consensus expectation of +59,000. On the surface, this looks like a welcome strength. Beneath that number, the composition tells a more cautious story.
Approximately 35,000 of the gain came from the reversal of the Kaiser Permanente healthcare strike. These were workers returning to jobs they already held, not new hiring. Construction added 26,000, partly recovering from winter weather-related declines. Meanwhile, financial activities lost 15,000 positions, and federal government employment declined by 18,000 as part of the ongoing workforce restructuring.
Much of the decline in the unemployment rate (from 4.4% to 4.3%) came from 396,000 people leaving the labor force, not from employment gains. Average hourly earnings growth slowed to 3.5% year-over-year, the weakest since May 2021.
For real estate, this matters because job quality and wage growth drive household formation, retail spending, and travel demand. These are the cash-flow engines of most property types.
Federal Reserve: On Hold, But No Longer Leaning Toward Cuts
The FOMC held the federal funds rate at 3.50-3.75% during its March 17-18 meeting, as expected. What changed was the tone. The Fed raised its 2026 Personal Consumption Expenditures (PCE) inflation forecast to 2.7%, the largest single-meeting upward revision since June 2022, and explicitly acknowledged uncertainty from Middle East developments.
The dot plot still shows a median of one 25-basis-point cut this year, but seven of nineteen participants now see no cuts at all in 2026. For March the futures markets were pricing zero rate cuts for 2026, with roughly 30% probability assigned to the possibility of rate hikes through early 2027.
The minutes, released April 8, revealed that some policymakers discussed whether a “two-sided description” of rate decisions was appropriate, acknowledging that hikes, not just cuts, could become necessary if inflation remains elevated. This is an important shift in the policy conversation.
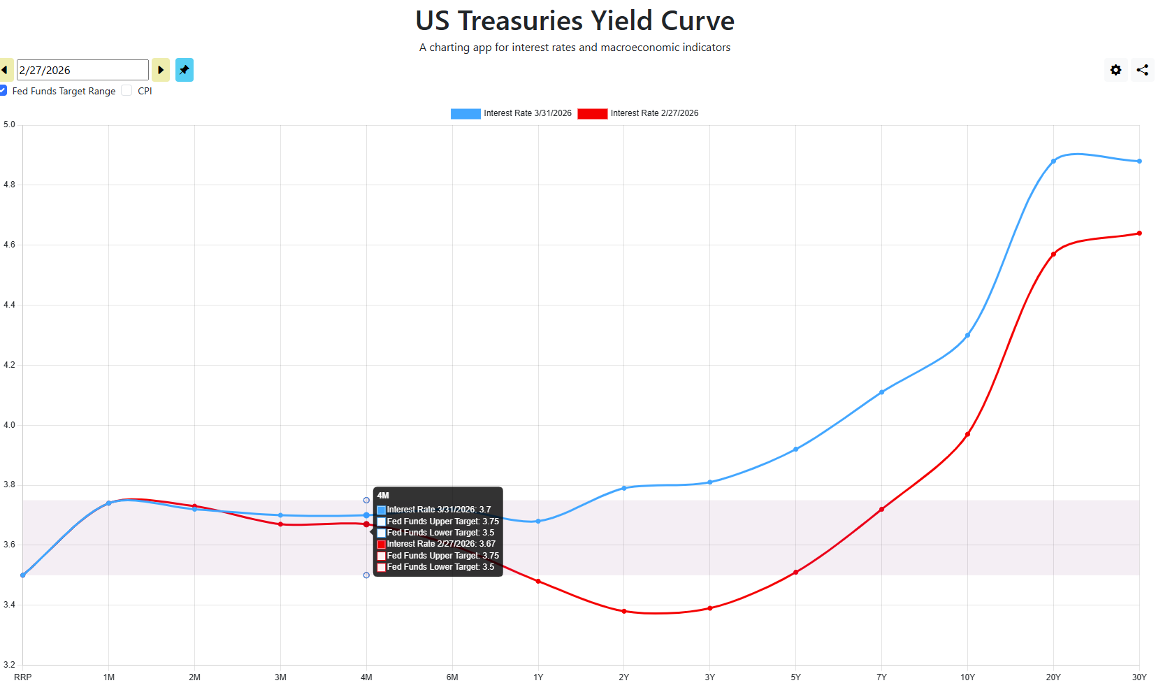
Yield Curve and Treasury Markets
Treasury yields rose sharply across the curve in March, reflecting the inflation outlook and geopolitical risk premium:
|
Equity Markets: Worst Month for S&P 500 Since 2022
|
Energy was the only positive sector in March, gaining 10.3% as oil prices surged. The Magnificent Seven tech stocks were battered, with six of seven in bear-market territory for the quarter. The VIX topped 30 during the month. A late-month rally on reports of potential Iran ceasefire talks provided some relief but did not reverse the broader damage.
What This Means for Investors
Multiple forces are at work at once: an energy-driven inflation shock, a Fed that is no longer leaning toward cuts, rising yields across the curve, and equity markets repricing risk. This combination shifts attention away from macro direction and toward portfolio construction. Specifically, toward strategies with documented collateral value, shorter duration, and income that does not depend on market sentiment to be realized.
Real Estate Market Impact
March’s macro picture is translating directly into real estate behavior. The combination of surging energy costs, rising yields, and policy uncertainty is changing how borrowers, operators, and lenders approach every transaction.
Multifamily: Supply Relief Ahead, But Near-Term Pressure Persists
National multifamily vacancy reached 8.5%, the highest in the current cycle, and rent growth remained near zero at 0.1% year-over-year nationally. Operators continue to prioritize occupancy over aggressive rent increases, particularly in Sun Belt and Mountain markets where new supply has been most concentrated. Austin saw rents decline 4.7% year-over-year, with Denver and Tampa also posting negative growth.
The constructive counterpoint: the construction pipeline has contracted 48% from its 2023 peak, and deliveries are expected to decline 36% in 2026 to approximately 333,000 units. This supply relief is real, but it takes time to work through the system. In the interim, higher energy costs from the Iran conflict are eroding renter discretionary income, adding another pressure point for operators managing thin margins.
Retail: Tight Vacancy, But Consumer Spending Under New Pressure
Retail remains the tightest CRE sector at 5.2% vacancy, down 210 basis points year-over-year, with cap rates compressing for well-located, necessity-based assets. However, the energy price shock introduces a direct headwind for consumer-facing retail, this means reduced discretionary spending and greater sensitivity to local employment conditions.
The gap between necessity-based and discretionary retail continues to widen. Properties anchored by grocery, medical, and essential services remain resilient, while assets with near-term lease rollover or exposure to discretionary tenants face increasing scrutiny.
Hospitality: Most Cyclical, Most Exposed to Energy Costs
Hospitality remains the sector most sensitive to the current environment. Rising energy and operating costs add to the margin pressure that was already present, particularly for lower chain-scale properties. Higher fuel costs directly affect travel demand and operating budgets at the same time. Properties with strong operators and stable demand drivers continue to perform, but the range of outcomes across the sector is widening.
CMBS Distress: A Record You Do Not Want to Set
The CMBS distress rate climbed to 12.07% in March, the highest reading on record, with the special servicing rate reaching 11.0%. Office properties drove the increase, accounting for over half of the $2.9 billion in loans transferred to special servicing during the month.
Looking ahead, $76.6 billion in hard CMBS maturities are due in 2026, with 39% concentrated in Q4. Among maturing loans, 36% have debt yields at or below 8%. This is the segment most likely to face refinancing friction in the current rate environment. This maturity wall reinforces a theme we have emphasized: the market’s central question is no longer about rate direction. It is about who can refinance on acceptable terms and who cannot.
Current Events
Iran Conflict: The Largest Energy Shock in a Generation
The military conflict that began February 28 with US and Israeli strikes on Iranian nuclear facilities escalated through March. The closure of the Strait of Hormuz, which normally handles approximately 20% of global oil supply, triggered the most severe energy price shock since the 1990 Gulf War.
Brent crude surged 63% in March, settling at $118.35 per barrel, the largest monthly gain in the benchmark’s history dating to 1988. WTI crossed $100 for the first time since July 2022. The International Energy Agency coordinated the release of 400 million barrels from emergency reserves, and late-month reports of potential ceasefire talks provided some relief. However, the situation remains tense.
Private Credit Redemption Crisis Deepens
The structural challenges we highlighted in our February update have intensified. March saw what some commentators are calling the “Great Liquidity Squeeze” in private credit:
BlackRock/HPS Corporate Lending Fund ($26B): Capped redemptions at 5% of net assets after investors requested 9.3% ($1.2 billion). Only $620 million was paid out. This was the first time the fund hit its redemption limit since inception.
Blackstone BCRED ($82B): Met 100% of record 7.9% (~$3.8 billion) in redemption requests, raising its tender offer and having firm employees cover the balance.
Blue Owl Capital Corp II: Ended regular quarterly redemptions entirely, switching to periodic payouts funded by asset sales after completing the $1.4 billion direct lending portfolio sale we discussed last month.
The drivers remain the same we have been emphasizing: structural mismatch between semi-liquid fund vehicles and illiquid underlying assets, heightened by AI-driven disruption fears in software-heavy BDC portfolios, notable defaults, and retail investor behavior that differs from institutional capital in important ways.
The lesson for investors has not changed: private credit is a valuable tool for portfolio diversification and enhanced income. But fund structure, liquidity terms, and underlying credit quality matter more than headline yield or brand recognition. Do not fall into the trap of assuming that larger or more recognized names eliminate structural risk. In many cases, scale amplifies it.
Tariff Policy: A Shifting Legal Picture
The trade policy environment continued to shift in March. Following the Supreme Court’s February ruling striking down IEEPA-based tariffs, the administration imposed a 10% import surcharge under Section 122, effective February 24. In early April, new Section 232 actions introduced tariffs of up to 100% on patented pharmaceutical imports and restructured metals tariffs to 50% on primary steel, aluminum, and copper.
For real estate, the most direct impact comes through construction materials costs. Higher tariffs on metals and potential second-order effects on building materials add upward pressure to construction budgets, right as energy costs are also rising. This combination reinforces a cautious approach to new construction-dependent lending.
Understanding Private Debt: Not All Fixed Income Is Created Equal
Given the headlines about private credit redemptions, fund gating, and predictions about the end of private debt’s “golden era,” we think it is important to step back and explain what private debt actually is and how complex the category has become.
Fixed Income Deserves More Than an Afterthought
For most of the past two decades, the typical investment conversation went something like this: you spent 95% of the time talking about equities, and if there was time left over, you glanced at fixed income. It was the boring part of the portfolio, a dampener, something you held because you were supposed to.
That changed in 2022. In that year, traditional fixed income failed in the exact moment investors needed it most. Stocks and bonds fell together, in some cases catastrophically. The Bloomberg Aggregate Bond Index dropped more than 13%. If you held a traditional fixed income portfolio through that period, you may still be recovering those losses.
That experience forced a rethinking. If traditional fixed income can lose 10 to 14% in a single year and move in lockstep with equities, then it is not doing the job investors thought it was doing. The question became: is there a way to build a fixed income allocation that actually delivers on the promise of stability, income, and low correlation to stocks?
The answer, for a growing number of investors, has been private debt. And that brings us to a concept that is often misunderstood.
Private Debt Is Not One Thing
When people hear “private debt” or “private credit,” they tend to think of it as a single category. It is not. Private debt is an enormous, complex universe that spans dozens of strategies, risk profiles, and asset types. Consider just a partial list:
Direct corporate lending: Loans to mid-market and lower-middle-market companies, often through Business Development Companies (BDCs) or Interval Funds. These are the funds making headlines right now for AI-related software exposure and redemption pressures.
Venture debt: Lending to early-stage and growth companies. High failure rates in the underlying companies mean this segment carries equity-like risk with a debt label.
Distressed debt: Purchasing debt of companies in financial difficulty at a discount, with the expectation of recovery. This is a specialized, opportunistic strategy that requires deep credit expertise.
Collateralized Loan Obligations (CLOs): Structured vehicles that pool leveraged loans and slice them into tranches with different risk and return profiles.
Mezzanine debt: Subordinated loans that sit between senior debt and equity in the capital stack. Higher yield, but also higher risk if things go wrong.
Real estate bridge lending: Short-term, first-lien loans secured by physical real estate, sized to current property values. This is where Kirkland Capital Group operates.
Each of these strategies has different risk drivers, different return profiles, and different vulnerabilities. A BDC with 30 to 40% of its portfolio in software companies faces a completely different set of challenges than a bridge lender making twelve-month loans against verified property values. Yet the financial press often treats them as one category when reporting on “private credit.”
This matters because when you read that “private debt is in trouble,” the natural instinct is to worry about any investment that falls under that label. But the trouble at a $26 billion corporate lending fund gating redemptions has very little to do with a $42 million real estate bridge lender that has never used leverage.
Why the Headlines May Not Apply to Your Investment
As mentioned, the headlines about private credit in 2026 are dominated by a few themes: massive funds limiting or halting redemptions, fears about AI disruption in BDC and interval fund portfolios, and broader predictions that private debt’s “golden era” is ending.
These are real issues, but they are concentrated in specific parts of the private debt universe. The redemption pressures earlier at BlackRock/HPS, Blackstone BCRED, and Blue Owl are driven by a structural problem: these funds packaged illiquid assets into semi-liquid vehicles and sold them to retail investors. When those investors, who tend to be more reactive than institutional capital, want their money back at the same time, the fund cannot sell its underlying loans fast enough to meet the demand. That is a fund structure problem, not a private debt problem.
Similarly, the AI-driven write-down fears in BDC portfolios reflect the specific risk of lending to software companies that may be disrupted by new technology. That risk has nothing to do with a loan secured by a multifamily property in the Pacific Northwest or a retail center in Texas.
The point is not that private debt has no risks. Every investment carries risk, and anyone who tells you otherwise is not being honest. The point is that the risks vary enormously across the private debt spectrum, and investors should evaluate their specific exposure rather than reacting to headlines about a category that is far broader and more complex than most reporting suggests.
The Takeaway for Investors
Fixed income is no longer the boring section of the portfolio. It has not been since 2010. For investors who are rethinking how their fixed income allocation is built, private debt offers a genuine opportunity to diversify within fixed income itself, to find strategies with low correlation to both equities and traditional bonds, and to generate real income from performing assets.
But private debt requires the same due diligence as any other investment. Understand the strategy. Understand the structure. Understand what breaks it. Understand that private markets are less liquid and this can be a positive factor for one’s portfolio.
What This Means for Kirkland Income Fund
Conservative Underwriting as Protection
Our weighted average loan-to-value ratio stands at approximately 58%, anchored to as-is values, not projected future valuations, not speculative rent growth, not cap-rate compression. In a market where CMBS distress has reached a record 12.07% and $76.6 billion in maturities face refinancing uncertainty, that distinction matters more than ever. With 42 cents of borrower equity standing between our capital and market volatility on every dollar of collateral, our conservative leverage provides a real buffer against the valuation pressure that rising yields and energy-driven cost increases are creating across the broader market.
Short Duration Limits Exposure
Originated Loans have a maturity of 12 to 24 months and much of the portfolio is seasoned to durations event shorter. In a month where Treasury yields rose 35 to 44 basis points across the curve and the Fed raised its inflation forecast to 2.7%, long-duration exposure carries real repricing risk. Our shorter-duration loans allow the portfolio to reprice and re-underwrite as conditions evolve, rather than being locked into structures that may become mismatched to market reality. This is exactly the risk playing out in CMBS portfolios with back-loaded maturity walls and in large private credit funds whose illiquid assets cannot keep pace with redemption demands.
With rate cuts no longer the base case and the market now pricing the possibility of hikes, borrowers locked into long-term structures face a very different refinancing environment than many expected. Our loans turn over regularly, which means we can adjust pricing and terms to reflect where the market actually is, not where it was six or twelve months ago.
Investor Questions
Investor question: "Given that the fund has operated since 2020 and has not yet experienced a downturn comparable to 2008, I wanted to ask how you think about extreme downside scenarios."
While the Fund has operated since 2020 and has not experienced a crisis identical to 2008, it has navigated multiple years of constrained refinancing markets and elevated capital stress. These conditions have already tested borrower liquidity, exit assumptions, and collateral valuations.
With respect to a 2008‑style recession, the Fund does not rely on a single deterministic model that claims to be “2008‑proof.” The view expressed consistently by management is that deep left‑tail events cannot be perfectly modeled or hedged, and any strategy claiming otherwise should be treated skeptically.
Instead, the Fund focuses on structural resilience, that includes:
Small, diversified loan sizes.
Conservative “as‑is” collateral valuations.
Low loan‑to‑value ratios.
Short loan durations.
First‑lien senior positions with full recourse.
Diversified borrower base.
Diversified property type.
Diversified geographical location.
No raw land or construction.
These features are designed to improve outcomes across a wide range of adverse scenarios, including severe valuation declines and limited refinancing availability. While extreme systemic events could still produce stress or temporary impairment, the portfolio is intentionally constructed to be durable rather than optimized for a single historical crisis scenario.
Diversification is expected to limit the impact of sector‑specific losses; defaults are an operational reality but have not translated into realized losses to date; and while no portfolio can be fully insulated from extreme systemic shocks, the Fund is built with conservative credit protections intended to preserve capital through adverse cycles.
