
March 2024 Newsletter
Month of March Index Returns vs KIF:

How are we different?
There are a lot of people who are starting their own private lending business. What is noticeable is that they are all focusing on lending in a few areas.
If they are big, they are creating a large portfolio of diversified Collateralized Loan Obligations (CLO), Commercial mortgage-backed securities (CMBS), and large commercial loans.
Smaller lenders are mostly competing in the single-family residential fix-and-flip or construction lending space.
It is noteworthy that, in line with our prior observations regarding increasing volatility, more people are now trying to enter the lending arena. People always rush into attractive spaces. This has happened many times before. The only things that change are the type of investment and the people involved.
Over time, those who chase what is hot eventually give up when they realize it's difficult and they perform poorly compared to the current market participants.
Our specialty is micro-balance commercial real estate bridge lending, and it is not the same area that all these new lenders are competing for.
I am often asked, with all the private lending options out there, “Why invest in the Kirkland Income Fund?”. What makes us different? There are many aspects but the key elements of difference:
Differentiated inefficient space. Our niche is micro-balance commercial real estate.
Existing and growing network for sourcing loans in this space. Enables us to consistently receive a flow of borrowers.
Decades of experience in underwriting, investment management, and risk management. This will help control risks and navigate the dynamic changes we are seeing in the markets.
We run a portfolio that is diversified by property type, geographical location, and differentiated borrowers. We only originate micro-balance commercial mortgages and have no style drift.
We can describe our uniqueness in words and back it up with figures. The American Investment Council recently reported that US private debt funds had a net return of 8.2% in the past 12 months ending September 2023. During the same period, KIF had a net return of 11.22% to investors. This shows a difference of 3.02%.
Inflation Battle
We all know that inflation has been persistent. The Fed has made it clear that inflation is the enemy and they are willing to cause collateral damage in their war against it. The statistics from the battle front are showing the Fed’s fight is far from over. As a recap inflation is still higher at 3.5%. Wage inflation growing faster than inflation. Shelter costs accounts for 60% of the annual inflation rise.
Small-cap real estate
Boxwood Means reported that the sales volume of small-cap commercial real estate dropped by almost 30% to $226 billion compared to the previous year. It also fell by a significant 40% from its peak in 2021, which was $373 billion.
This decrease was due to increasing market uncertainties, high debt costs, and disagreements between buyers and sellers on prices. This downward trend in sales is similar to what was observed in the large-cap commercial real estate market, where deal volume decreased by 51% in 2023. This was the largest annual decline since 2009, as per reports from MSCI.
However, there was a divergence between the large and small-cap domains in terms of property prices last year. MSCI reported that CRE prices for mainly larger properties dropped 5.9% on average in 2023, with a huge 16.1% loss in the office sector and an 8.4% decline in multifamily.
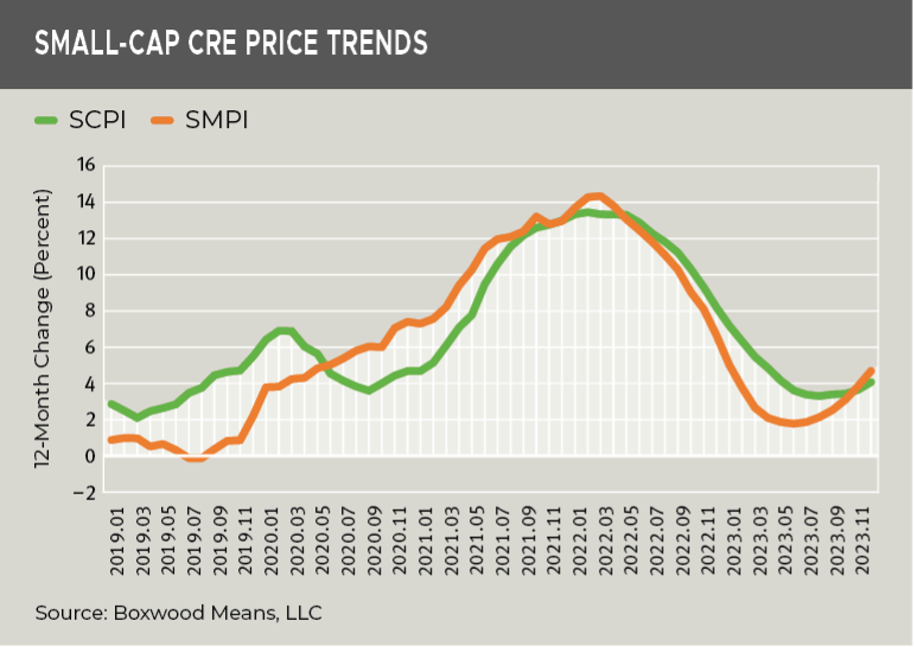
On the other hand, as the chart below shows Boxwood’s Small Commercial Price Index (SCPI) went up 4.2% last year, and the Small Multifamily Price Index (SMPI) rose 4.9%.
As we have mentioned before, as news about failing commercial markets started to arise, it is important to realize that small cap commercial property does not always correlate with the larger commercial real estate market that is talked about in the major news.
This is not to say there will not be episodes of uncertainty and volatility caused by broader economic occurrences.
Continued Rise of Private Credit
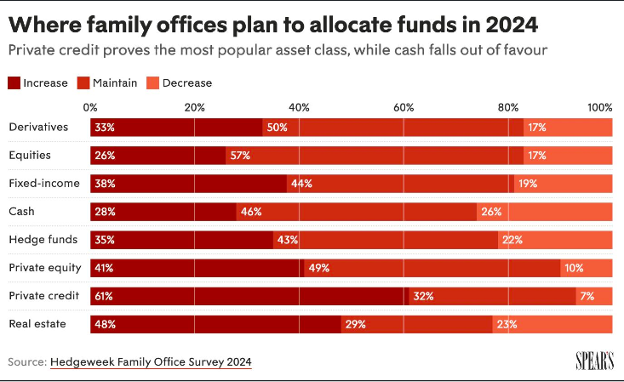
Interest in Private Credit continues to grow. We have more data to follow up last month’s discussion around the Rise of Private Credit. I also like this chart as it shows other areas of family office interest including traditional investments.
Data on Lending Rates
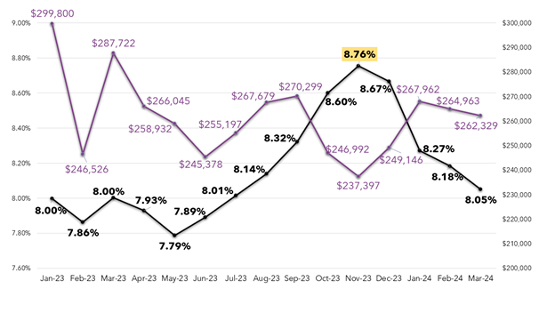
The data below is collected by Geraci and is comprised of DSCR loans (for investment property) only. These loans are not always bridge loans, nor are they all commercial real estate. We certainly monitor, as an indicator of supply and demand, forces on lending rates.
The chart below shows monthly changes in average rates for DSCR loans and their average size. Rates are slightly decreasing. We believe this is because new lenders are trying to enter the market. The Federal Reserve hasn't adjusted rates yet, so it will be interesting to see future developments.
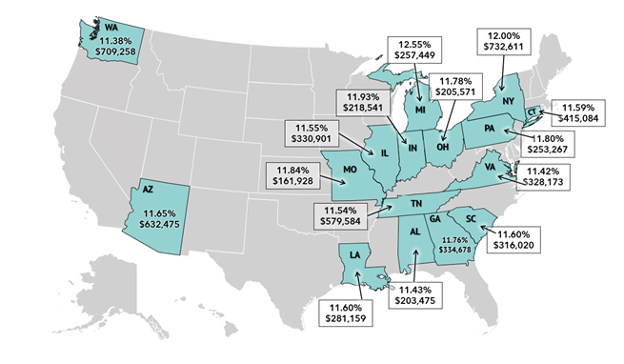
Rates are coming down on average. But bridge loans for fix-and-flip residential loans on average are still 11.38%, with many states charging much higher.
The picture below is created from data collected by Geraci from all their clients in the private residential real estate bridge lending space. In the micro-balance commercial real estate space, we are seeing coupons 100 to 300 basis points over these rates.
If you have any questions about the newsletter or the Kirkland Income Fund, please do not hesitate to reply or book a call with me.
