
For much of the past two years, real estate owners have operated under the assumption that interest rates would eventually decline and make refinancing easier. September continued to challenge that assumption.
The Federal Reserve (“the Fed”) raised its target rate by 0.25 percentage points to a range of 3.75% to 4.00%. For borrowers approaching maturities, the decision increased the importance of addressing leverage, liquidity, and repayment plans under current conditions rather than relying on lower financing costs.
That produces this month’s guiding question:
What happens when borrowers can no longer rely on lower interest rates to complete their business plans?
Economic Overview: A Shift From Uncertainty to Action
In September, the Fed unanimously increased the federal funds target range by 25 basis points to 3.75% to 4.00%. The Fed stated that inflation remained elevated and that the increase would support a timelier return to its 2% target inflation rate.
Treasury yields moved higher across the curve during September. The 10-year Treasury yield increased from 4.75% on August 31 to 5.29% on September 30, while the two-year yield increased from 4.34% to 4.88%.
|
Interestingly, both the two-year and ten-year yields had a similar 54-basis-point increase. Higher benchmark rates affect borrowing costs, required investment returns, and the prices buyers are willing to pay for income-producing assets.
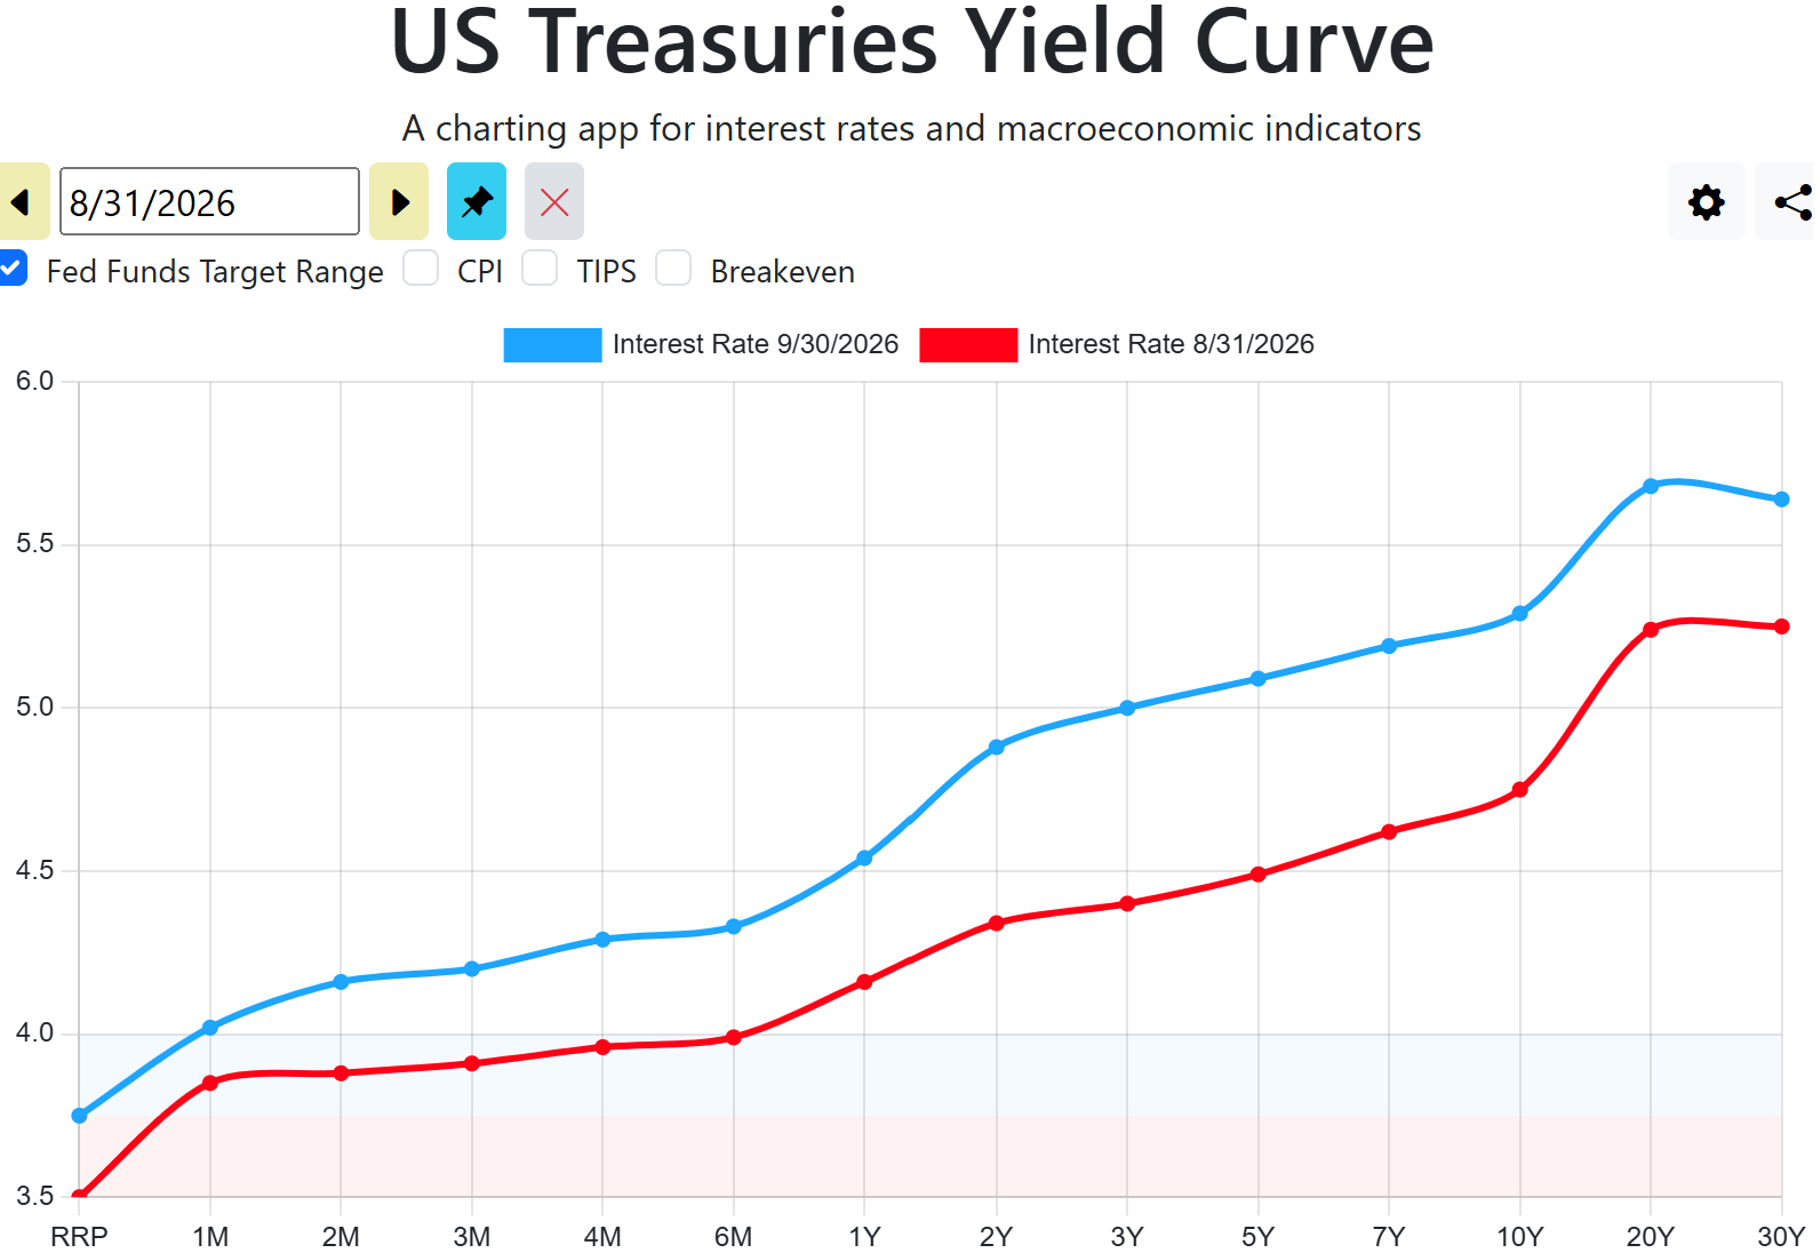
Interest rates are only part of the economic picture.
September’s employment report showed nonfarm payrolls increasing by 29,000 and unemployment at 4.2%. The unemployment rate has remained within a relatively narrow range of 4.1% to 4.3% since March 2026, suggesting that the labor market has cooled without experiencing a broad deterioration.
September at a Glance
|
||||||||||||||||||||||||||||
Together, September’s data reinforced that borrowers should plan for elevated financing costs rather than wait for lower rates, even as slower hiring added uncertainty to the growth outlook.
The September data also presented a more difficult combination of factors for investors to consider. Stronger inflation and slower hiring increase the importance of investments that can generate income under current conditions without relying on lower rates, stronger growth, or rising asset values.
Real Estate Market Impact: From Waiting to Adapting
These conditions do not automatically point to a recession or a broad real estate downturn. They do make it harder for borrowers to rely on economic growth, rent increases, or lower rates to fix a loan that the property cannot support today.
For real estate owners, the September economic data made delays more costly. Those approaching a loan maturity may need to invest more of their own money, pay down part of the debt, sell another asset, scale back the property plan, or accept refinancing terms that differ materially from the original assumptions.
For a new investment, the test is straightforward: it should work under today’s conditions. If repayment requires lower rates or higher property values, the opportunity may not justify the risk.
On the other hand, commercial real estate data for the month pointed in different directions. CBRE Econometric Advisors described capital markets as constructive but more selective and expects near-term performance to come mainly from income rather than appreciation. For lenders, that puts more weight on what a property earns today than on forecasts of lower rates or higher values.
Hospitality provided one example of improving operations during the month. For the week ending September 26, CoStar reported year-over-year increases of 6.4% in occupancy, 7.4% in average daily rate, and 14.2% in revenue per available room.
Multifamily conditions also continued to improve gradually in September. Apartments.com reported that annual rent growth strengthened nationally as supply pressures eased, although monthly rents declined modestly with the normal seasonal slowdown.
Taken together, these indicators suggest that operating fundamentals remain constructive in selected sectors while outcomes continue to depend on the individual property, market, sponsor, and financing structure. For KIF, property type is just the starting point. What matters is whether the property is producing cash today and whether the borrower has a credible way to repay the loan.
What This Means for Kirkland Income Fund (KIF)
September’s rate increase does not change KIF’s strategy; it makes careful selection more important. The Fund must continue to distinguish between borrowers facing a temporary financing gap backed by sufficient property value and borrower equity, and borrowers whose properties or repayment plans cannot support additional debt.
Conservative Underwriting as Protection
KIF’s portfolio weighted loan-to-value ratio is 61.7%. This means borrowers, on average, have meaningful value beneath the Fund’s loan position.
KIF underwrites a property based on what it is worth and earns today, rather than depending on future appreciation, renovations, or unproven income growth. Expected improvements can strengthen a loan, but they are not the Fund’s main source of repayment or protection. This approach cannot eliminate losses, but it reduces reliance on a favorable market outcome.
Continued Outperformance
Indices Performance Versus KIF
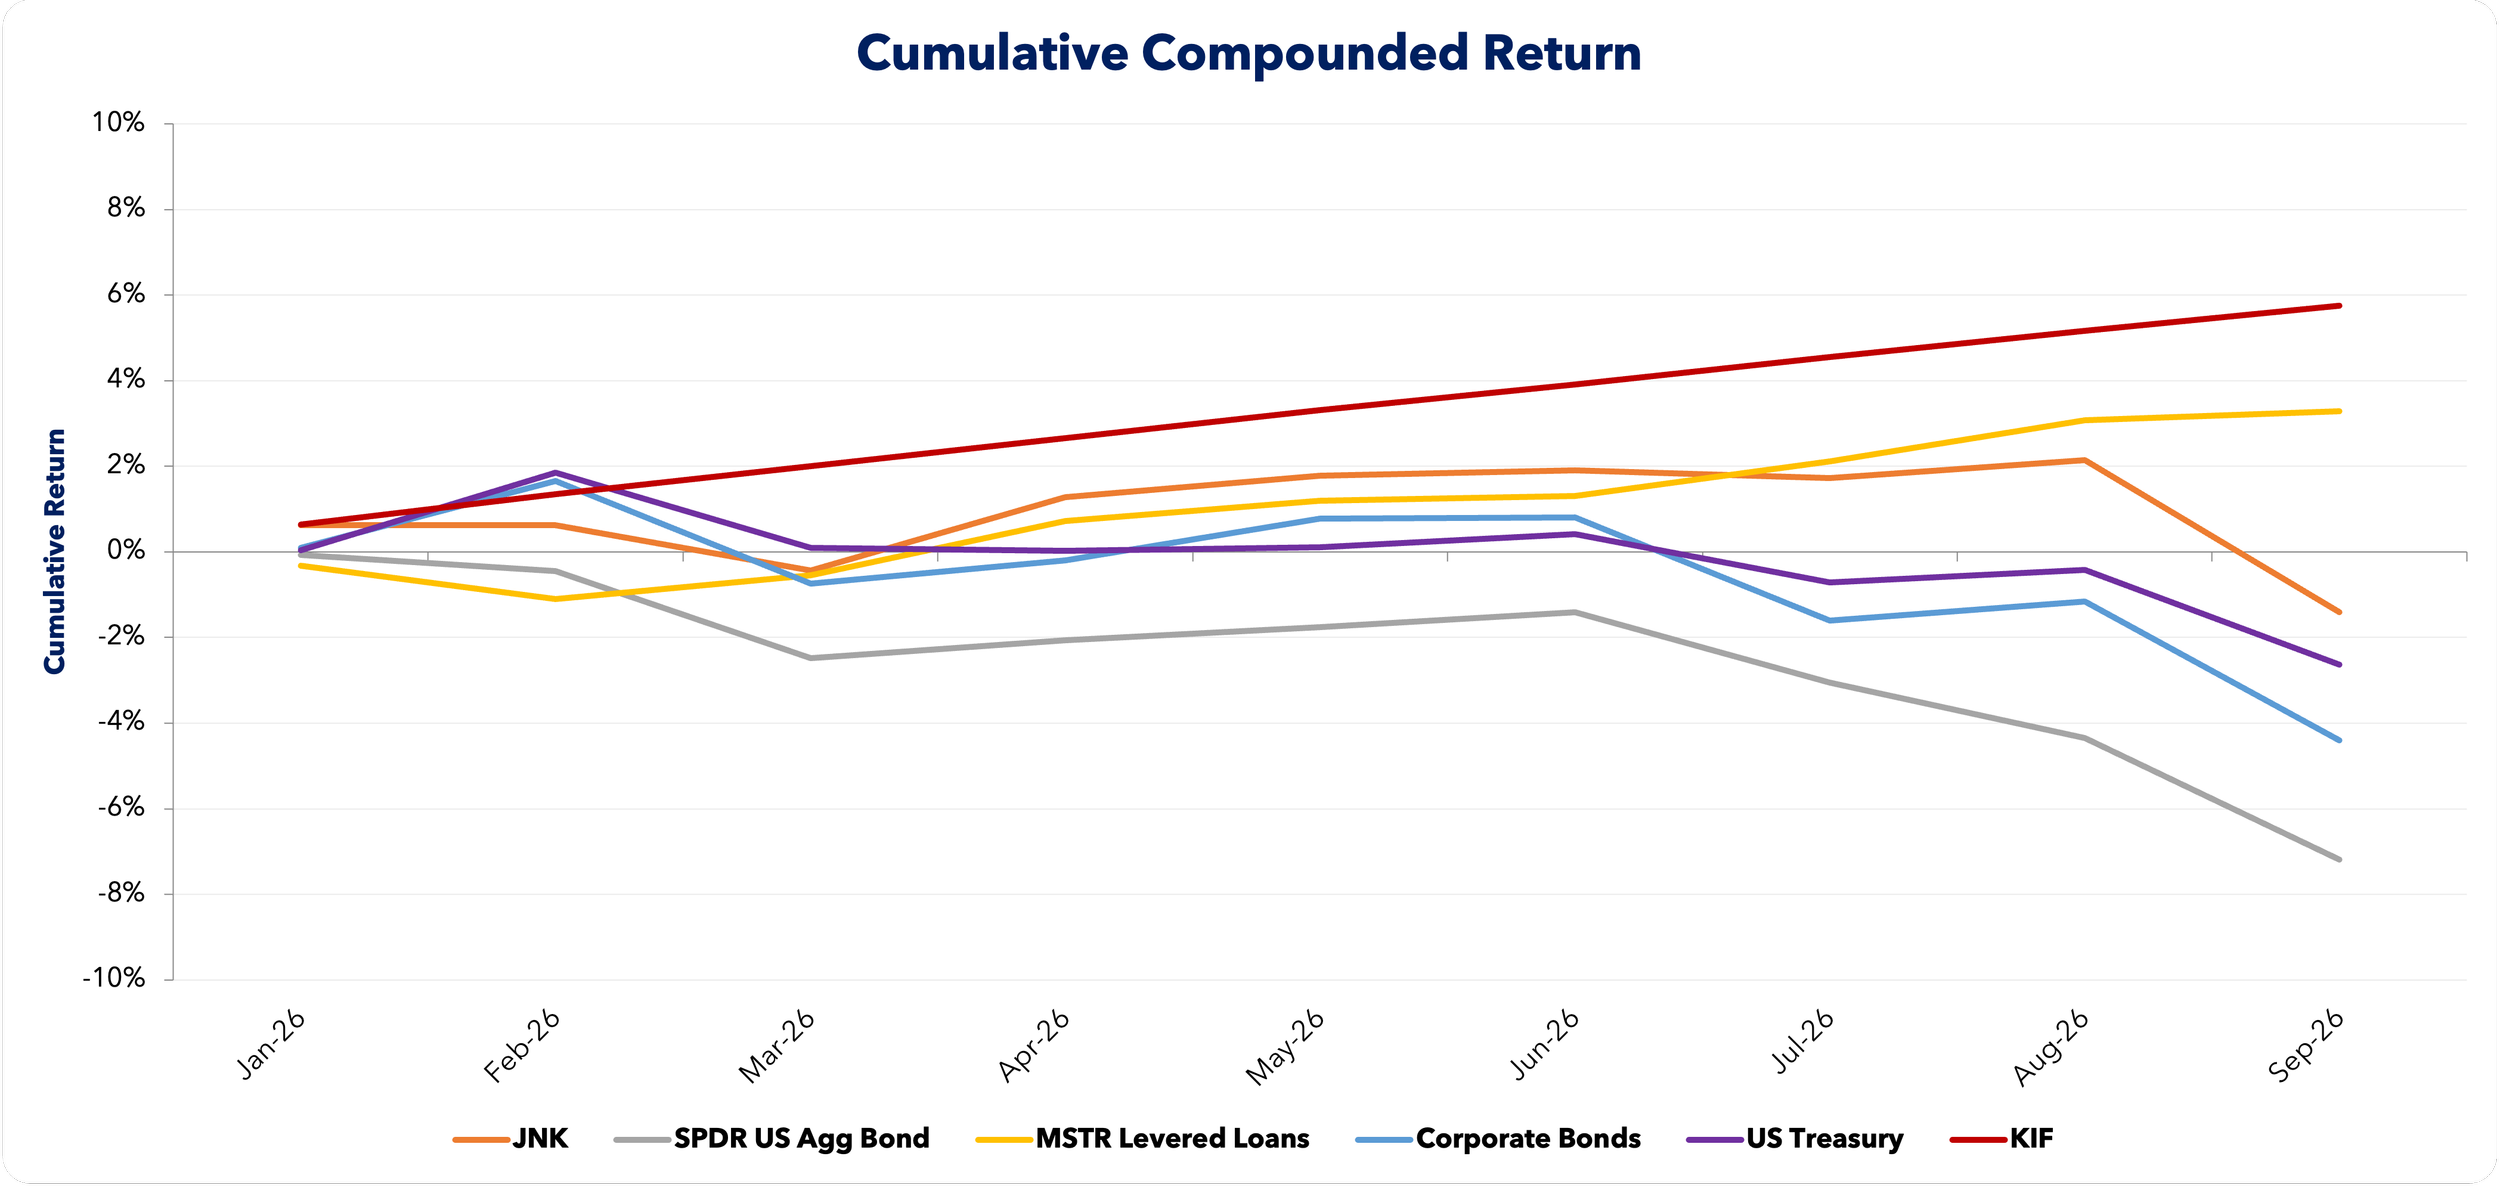
Through September 2026, KIF generated a compounded net year-to-date return of 5.75%. Over the same period, the selected public indices produced total returns, including reinvested distributions, ranging from -7.19% to 3.29%.
Mutual Funds and ETFs Performance Versus KIF
Through September 2026,the selected public fixed-income funds produced total returns, including reinvested distributions, ranging from -3.48% to 2.18%.
We gave a more detailed description of these funds in the August newsletter.
To give a broader view, we also included a performance summary beginning in April 2020, the Kirkland Income Fund’s inception.

Educational Insight
Why do we share all of this comparative data.
For many years we have thought about tackling the difficult discussion of benchmarking. At its surface it is a simple idea. However, to successfully benchmark an investment over time is extremely complex and even more so in the private markets. Below we are going to introduce the idea of benchmarking and how it can shift from traditional and private investments and relate this back to the Kirkland Income Fund. In the months to come, we will continue to explore more benchmarking details.
Benchmarking: A Smarter Way to Evaluate Performance
Most investors judge a return by the numbers alone. Eight percent feels good, six percent feels low, and anything below a personal target can feel disappointing. But as we often remind investors, “A return does not explain itself.” A number only becomes meaningful when you know what risks produced it and what realistic alternatives were available at the time.
Developing CONTEXT is the core purpose of benchmarking.
Why Benchmarking Matters
Benchmarking helps investors answer a better question than “Did I get the number I wanted?” It helps answer: Was the return reasonable for the structure, risks, and market environment in which it was earned?
This is important because market conditions change. Interest rates move, credit spreads widen and tighten, liquidity shifts, and competition among lenders evolve. A fixed return target like 8%, 10%, or any other number does not account for those changes. A proper benchmark should capture the dynamic shifts of a market.
Why Benchmarking Is Harder in Private Credit
Public markets have clean benchmarks: the S&P 500 for large cap equities or the Bloomberg Aggregate for broad fixed income. Private credit does not have easily definable benchmarks for all the varying types of private credit. As one of our earlier educational pieces notes, “No public index may closely match a fund’s loans, collateral, duration, payment priority, liquidity, fees, and underwriting strategy.”
Private credit spans first lien real estate loans, corporate direct lending, equipment finance, venture debt, and dozens of niche strategies. No single index captures all of that. This mismatch is called basis risk. This lack of perfect fit doesn’t make benchmarking useless. It simply means investors must use multiple reference points and understand what each one does and does not represent.
In the next newsletter we will dive into the comparison set for the Kirkland Income Fund and talk more about the components of the indices, funds, and ETFs compared above.
KIF Investor Question
Question: "If the Federal Reserve Just Raised Rates, Should Investors/Lenders Wait Before Committing Capital?"
Answer: Waiting for greater clarity can appear prudent, but the relevant issue is not simply where interest rates may move next. For a credit investment, the more immediate question is whether the loan is appropriately structured for current conditions.
A tighter lending market gives qualified borrowers fewer options. That can help a disciplined lender secure lower leverage, stronger collateral, and clearer repayment protections. The same market, however, also attracts borrowers whose plans no longer support more debt, so selectivity is paramount.
KIF does not base its underwriting on predicting the direction of interest rates. Each loan is evaluated using the property’s current value and income, the borrower’s equity and experience, and whether there is a clear path to repay the loan.
Looking Ahead
The fourth quarter is less about predicting the next policy decision and more about evaluating the opportunities created by a selective financing market. Higher yields alone do not make a loan attractive. The collateral, leverage, sponsor, documents, and repayment strategy must work together.
The question investors should consider is:
If today’s financing environment lasts longer than expected, are the investments in my portfolio structured to produce income without depending on lower rates or higher valuations?
KIF will continue to emphasize capital preservation, conservative as-is valuations, meaningful borrower equity, shorter loan maturities, and clearly defined repayment strategies. These standards can restrict near-term deployment, but maintaining them is more important than increasing loan volume simply because borrower demand is rising.
We invite investors to review the Fund’s latest performance information or schedule a short portfolio discussion to better understand how private real estate credit may complement an existing income allocation.
