
State of Micro-Balance Commercial Real Estate (CRE) Private Debt: 2025 Recap and 2026 Outlook for Investors

There is a gap in the market where banks do not provide much funding. It is a niche in commercial real estate quietly delivering 8–10%+ yields with first-lien security. It’s called micro-balance commercial real estate (CRE) private bridge debt—and it is where accredited investors are finding opportunity while others look away.
This paper provides a recap of 2025 and a forward-looking analysis of 2026, highlighting opportunities and risks for accredited investors seeking exposure to micro-balance CRE private debt.
Key Takeaways:
Micro-Balance CRE Defined: Loans between $200K and $1.5M, financing small income-producing properties (multifamily, retail, industrial).
Why It Matters: Underserved by banks → creates opportunity for private lenders and investors seeking 8–10%+ yields.
Data Note: Market data for micro-balance CRE is limited; we use small-balance CRE (<$5M) as a proxy for trends.
2026 Outlook: Waning of recession fears, stable and low inflation, stabilizing interest rates, a debt refinancing wave, and strong demand for housing/logistics create tailwinds for private debt strategies.
Investor Opportunity: Private debt funds, REITs, and debt syndications offer high-yield passive income with collateralized security.
Introduction: A Market at an Inflection Point
Imagine a market where traditional lenders are not present, leaving a gap that only private capital can fill. That is the reality of micro-balance CRE bridge loans today. These loans—too small for institutional lenders yet too complex for traditional lenders given current regulatory environment—finance the backbone of local economies: housing for working families, neighborhood retail, and small industrial spaces.
As 2026 begins, investors stand at a crossroads. Interest rates are stabilizing, liquidity is returning, and a wave of refinancing is reshaping the CRE landscape. For accredited investors seeking high-yield passive income with strong collateral protection, micro-balance CRE private debt offers an opportunity that is both timely and compelling.
2025 Recap: A Turning Point Toward Stabilization
The past year marked a turning point for commercial real estate. Inflation cooled to ~3% by Q4, and the Federal Reserve shifted from aggressive tightening to modest easing, cutting rates by 75 basis points late in the year. While economic growth slowed, the U.S. avoided recession, but unemployment rose to 4.6% in November.
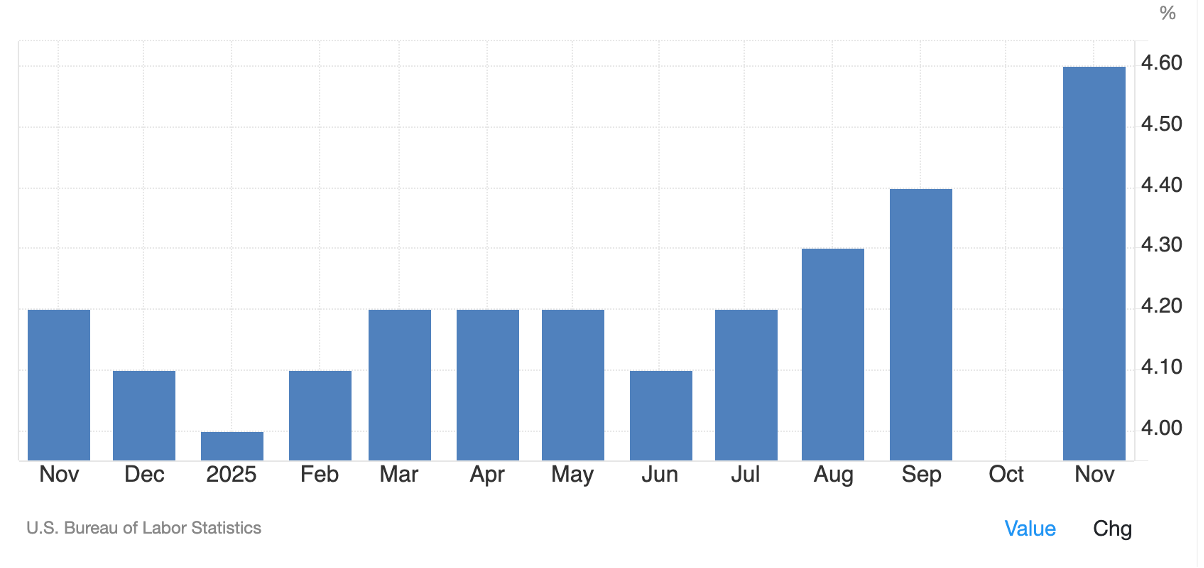
US Labor of Statistics Monthly Unemployment
Economic activity strengthened in the back half of the year, with Q3 GDP growth (+4.3%) reflecting a resilient U.S. economy despite tighter financial conditions. This late‑year momentum supported small‑business formation, consumer spending, and investment activity—factors that underpin many micro‑balance CRE property types such as retail, multifamily, and light industrial. The stabilization in GDP helped reinforce the recovery trend observed in small‑balance CRE transactions through Q3 2025.
Small-balance CRE transactions—those under $5 million—began to recover after a steep decline in 2023. According to Boxwood Means, sales through Q3 2025 were approximately 10% higher year-over-year, signaling renewed confidence heading into Q4. Cap rates, which had surged during the rate-hike cycle, stabilized:
| Asset Type | Cap Rate | Notes |
|---|---|---|
| Multifamily | 6.5–7% | for Class B/C assets |
| Industrial | 6–7% | |
| Retail | 5.5–7% | for essential retail |
| Retail (Value‑Add) | 8%+ | for value-add opportunities |
| Office | 8–10%+ | for generic small offices |
Distress in commercial real estate shifted notably in December 2025. While distress remained concentrated in office properties, the office delinquency rate actually retreated by 37 basis points to 11.31%, marking its second consecutive monthly decline—though it still ended the year well above prior Decembers. Lodging saw the largest rate increase, rising 44 basis points to 6.61%. Industrial delinquency ticked up by 13 basis points to 0.80%, and retail increased by 18 basis points to 6.92%, though retail remains below its recent peak. Multifamily delinquency continued to decline, dropping 34 basis points to 6.64%. Overall, multifamily and retail late payments remain far below crisis levels, while office and lodging sectors continue to warrant close attention.
Private credit filled the financing void. Non-bank lenders and debt funds raised record amounts of capital, with Preqin reporting $48 billion in private credit fundraising from high-net-worth investors in the first half of 2025 alone. These funds targeted short-duration, high-yield opportunities in loans above $5 million —notably, some of the risk and return characteristics that they sought are also present in micro-balance CRE loans. For micro‑balance CRE loans, community banks and credit unions have continued to finance stabilized properties, and regional banks—after stepping back in prior periods—have established as stronger presence in the segment.
Regulatory and Tax Tailwinds
2025 brought significant regulatory changes that benefit accredited investors:
Accredited Investor Verification Simplified: SEC introduced a safe harbor allowing large investments ($200K individual, $1M entity) to serve as accreditation proof—reducing friction in fundraising.
401(k) Access to Private Investments: A landmark policy shift could unlock retirement-plan capital for private credit strategies, expanding the investor base.
Tax Advantages via REIT Structures: The “One Big Beautiful Act” reaffirmed the 20% QBI deduction for REIT dividends, enhancing after-tax yields for real estate debt funds.
Looking at 2026 the SEC is working on a test to allow investors to meet accredited status via knowledge.
These developments make it easier and more tax-efficient for accredited investors to participate in micro-balance CRE private debt.
Micro-Balance CRE Private Debt: Why Investors Should Care
Micro-balance CRE loans or bridge loans typically feature:
Size: $200,000–$1.5 million.
Structure: 12–24-month terms, interest-only payments.
Rates: 10–13+% for senior bridge loans.
Collateral: First-lien security on income-producing properties at conservative “As-is” valuations and low loan-to-value ratios (50–70%).
Most banks avoid this segment due to the often-required loan customization and lack of current stabilization. With large legacy platforms and high fixed costs, underwriting small loans is expensive, and regulatory capital charges make them unattractive. For accredited investors, this creates an opportunity to earn high current income with strong collateral protection—a rare combination.
For a deeper dive into this asset class, read our Bridge Loan 101 article.
Asset Class Performance and 2026 Outlook
Micro-balance CRE spans multiple property types. Here’s what investors need to know:
Multifamily
Small multifamily assets—typically Class B/C properties in secondary markets—remained resilient in 2025. Occupancy held steady and rent growth slowed but stayed positive. Cap rates stabilized around 6.5–7%.
2026 Outlook: Expect continued demand for workforce housing, limited new supply, and potential cap rate compression if interest rates decline further.
Industrial
Industrial real estate continued to outperform. Vacancy for small warehouses hovered near 4%, and secular drivers such as e-commerce and supply chain reconfiguration remain intact. Cap rates averaged 6–7% in 2025.
2026 Outlook: Strong fundamentals, with potential appreciation as investors compete for limited supply.
Retail
Essential retail—grocery-anchored centers, pharmacies, and service-oriented tenants—proved resilient. Cap rates ranged from 5.5–7% for prime assets. Value-add retail offered higher yields (8%+) but carried execution risk.
2026 Outlook: Expect stability in essential retail and selective opportunities in experiential formats.
Office
Office remains the most challenging sector. Small offices saw cap rates of 8–10%+, reflecting elevated risk. Adaptive reuse and conversion projects will dominate the narrative in 2026.
2026 Outlook: Investors should approach office exposure with caution, focusing on medical office or mixed-use properties with strong tenancy.
Asset Class Comparison Table
| Asset Class | 2025 Cap Rate | Risk Profile | 2026 Outlook |
|---|---|---|---|
| Multifamily | 6.5–7% | Moderate | Stable rents; slight cap rate compression likely |
| Industrial | 6–7% | Low | Strong demand; potential appreciation |
| Retail (Essential) | 5.5–7% | Moderate | Resilient; steady income expected |
| Retail (Value-Add) | 8%+ | Elevated | Repositioning opportunities for higher returns |
| Office | 8–10%+ | High | Distress persists; conversions key |
While today’s cap rates provide a snapshot of current pricing and risk conditions, long‑term revenue trajectories offer deeper insight into each sector’s structural health. To complement the valuation perspective above, the table that follows summarizes Green Street’s forecasted revenue growth across major property types through 2029.
| 2018 | 2019 | 2020 | 2021 | 2022 | 2023 | 2024 | 2025 | 2026 | 2027 | 2028 | 2029 | |
|---|---|---|---|---|---|---|---|---|---|---|---|---|
| Apartment | 3.60% | 2.80% | -1.70% | 15.30% | 4.60% | -0.30% | 0.50% | 0.70% | 2.20% | 2.70% | 3.00% | 3.00% |
| Data Center | -4.60% | -4.10% | -0.20% | 1.30% | 6.60% | 6.90% | 13.70% | 7.10% | 6.00% | 5.40% | 4.50% | 4.40% |
| Industrial | 5.40% | 5.70% | 3.10% | 18.20% | 25.60% | 4.60% | -4.40% | -3.80% | 1.50% | 4.00% | 2.90% | 2.60% |
| Office | 2.20% | 3.60% | -7.90% | -5.40% | -3.70% | -5.30% | -1.90% | -0.30% | 1.10% | 1.70% | 2.30% | 2.60% |
| Self-Storage | -0.50% | -0.10% | 6.50% | 28.70% | -4.30% | -12.30% | -10.70% | -4.00% | 6.00% | 4.90% | 7.50% | 5.40% |
| Senior Housing | 2.40% | 3.20% | -8.70% | -1.60% | 8.60% | 8.20% | 6.90% | 6.90% | 6.50% | 5.90% | 5.20% | 4.70% |
| Single-Family Rental | 4.30% | 3.90% | 6.50% | 13.90% | 12.80% | 1.50% | 2.50% | 3.20% | 3.10% | 3.30% | 3.50% | 3.40% |
| Strip Center | 0.90% | 0.70% | -7.60% | 5.80% | 7.00% | 2.70% | 3.80% | 1.50% | 2.90% | 2.90% | 2.40% | 2.00% |
How to Create Your Portfolio
Accredited investors can access micro-balance CRE private debt through several vehicles:
Private Debt Funds: Diversified portfolios of micro-balance loans offering 8%+ annual returns with monthly or quarterly payouts. Ideal for those seeking predictable income and professional underwriting.
Syndications and Crowdfunding: Direct participation in individual loans offers equivalent returns (10–12%) but less diversification. Suitable for investors comfortable with deal-level risk but require greater transparency on each loan.
Pure Private Debt REITs (MREITs): Typically, illiquid vehicles that invest in private commercial real estate debt. Yields can be similar to or higher than private debt funds (6 to 10%+ range) depending on risk profile. Diversification is not inherently greater than private funds and depends on the REIT’s structure. Investors should carefully review liquidity terms and underlying asset composition before investing.
Interval Funds: Offer periodic liquidity windows but are only as liquid as the underlying assets. These funds tend to have higher structural costs, resulting in lower yields (5 to 9% range) compared to pure debt funds. While registered with the SEC, this does not guarantee safety—thorough due diligence is required to assess risks, costs, and redemption limitations.
2026 Outlook: Drivers, Risks, and Opportunities
Tailwinds
Interest Rate Relief: The Federal Reserve is expected to continue cutting rates in 2026, though at a slower pace than in 2025. These gradual reductions should lower borrowing costs and help stabilize or support property values.
Improved Long‑Term Financing Conditions: As rates decline, borrowers will have greater ability to refinance into long‑term permanent debt once their properties stabilize. This enhances loan repayment certainty and supports strong performance for micro‑balance CRE private debt strategies.
Refinancing Wave: Continued debt maturities for 2026, sustaining demand for private credit as traditional lenders are still restricted.
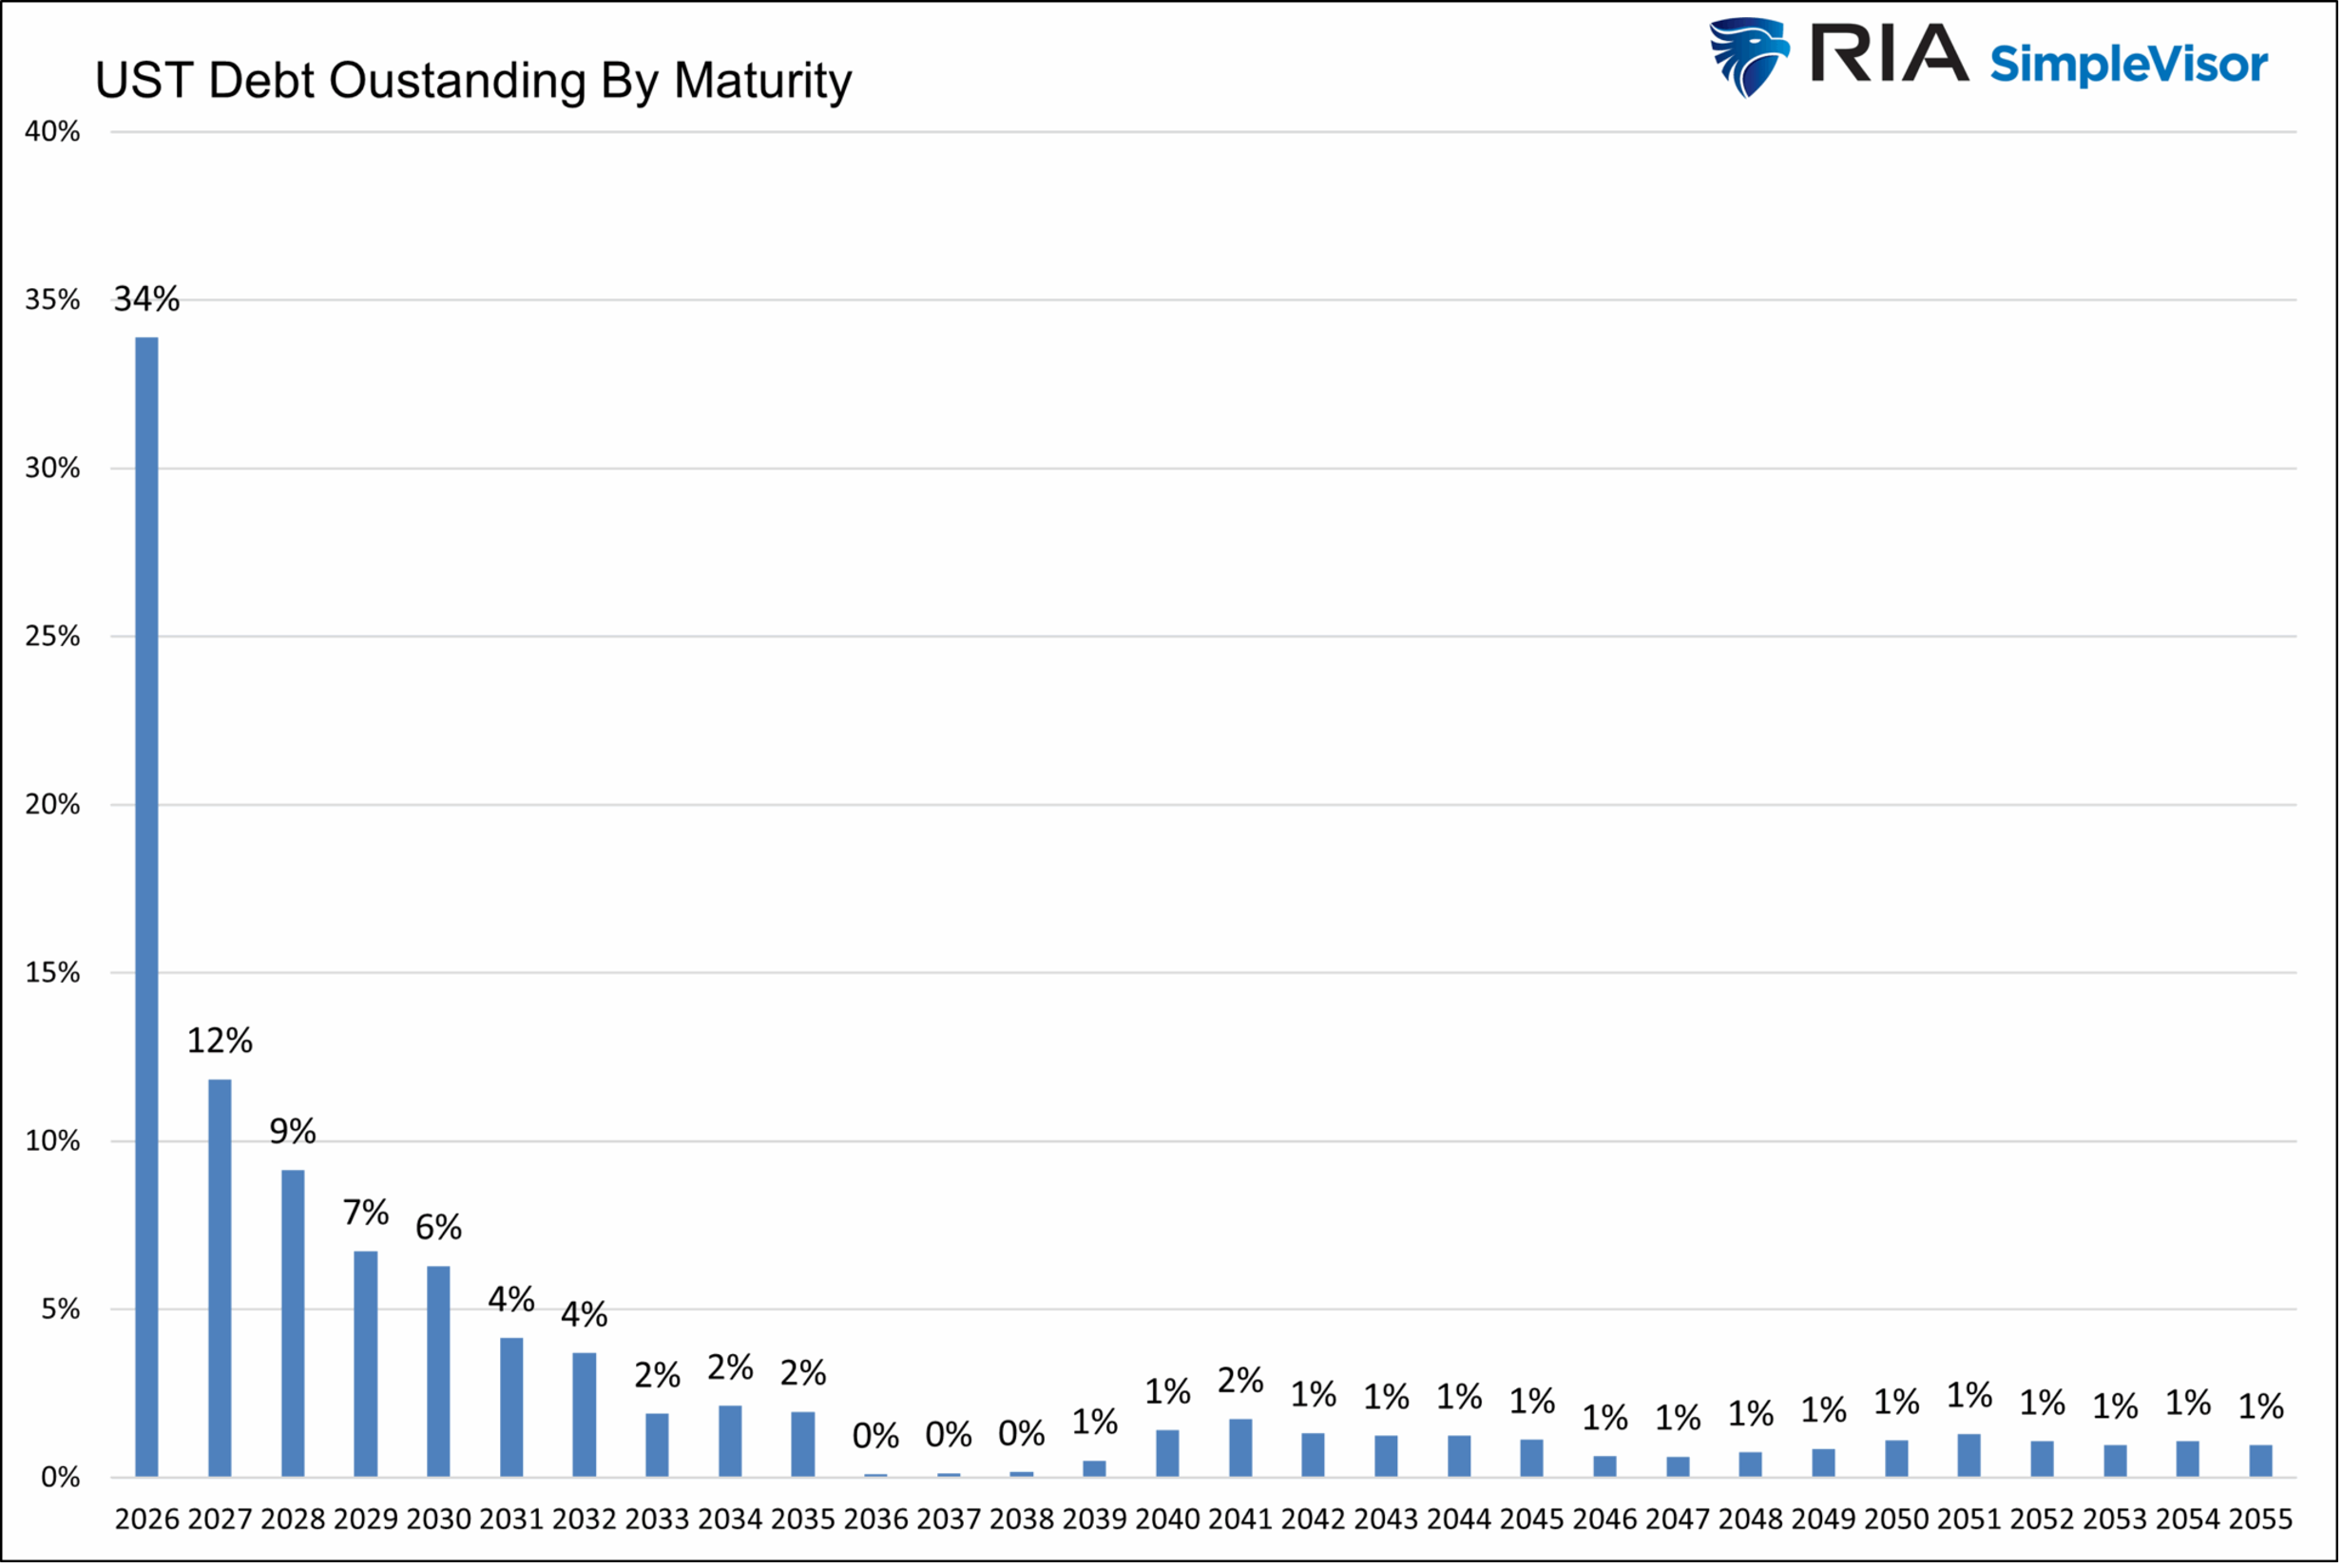
US Debt Outstanding By Maturity per Year
Strong Fundamentals: Housing and logistics sectors remain resilient given the constrained supply and steady demand, with a 75% decline in new multi-housing and industrial completions since the pandemic peaks, according to JLL.
Regulatory Changes: Basel III implementation could further constrain bank lending, increasing reliance on private credit.
Risks
Sector Distress: Office Defaults and value declines could ripple through lenders creating losses for investors and negative sentiment on the CRE space as a whole.
Macro Uncertainty: Economic uncertainty, recession risk and geopolitical shocks remain on the horizon.
Opportunities
Distressed Note Acquisitions: Banks offloading non-performing loans create entry points for opportunistic investors.
Adaptive Reuse Projects: Converting obsolete CRE (office) into residential or mixed-use offers upside for experienced operators.
Secondary Market Liquidity: Growth of platforms trading private fund interests may improve flexibility for investors.
2026 Outlook Summary
| Tailwinds | Risks | Opportunities |
|---|---|---|
| Interest Rate Relief: Gradual Fed cuts expected through 2026 will reduce borrowing costs and support property values. | Office Distress: Defaults and value declines could ripple through lenders. | Distressed Note Acquisitions: Banks offloading non-performing loans create entry points for opportunistic investors. |
| Improved Long Term Financing Conditions: As rates decline, borrowers will have greater ability to refinance into long term permanent debt once their properties stabilize. | Macro Uncertainty: Recession risk and geopolitical shocks remain on the horizon. | Adaptive Reuse Projects: Converting obsolete office into residential or mixed-use offers upside for experienced sponsors. |
| Refinancing Wave: Extended maturities from 2025 will roll into 2026, sustaining demand for private credit. |
Why This Matters for You
Micro-balance CRE private debt is not just a niche—it is a strategic opportunity. In a market where traditional lenders have stepped back, accredited investors can step forward and “Be the Bank” to capture high-yield, collateral-backed returns while supporting the backbone of local economies.
Kirkland Capital Group’s Role
Kirkland Capital Group specializes in micro-balance CRE bridge lending, enabling accredited investors to access this niche. Our focus on conservative underwriting, first-lien, full recourse asset backed loans, and short-term loans aligns with investor goals for high-yield passive income and capital preservation. As 2026 unfolds, we remain committed to bridging the financing gap in this underserved market—creating opportunities for investors to earn strong returns while supporting the backbone of local economies.
Download our term sheet to get an overview of the fund’s strategy, performance, portfolio highlights and more.