

Kirkland Income Fund Performance Metrics
Consistent High-Yield Performance
Performance Snapshot
Since Inception
As of May 2026
Fund at a Glance
Consistent and Stable Returns
Related Resource: “The Importance of Consistent and Stable Returns in Fixed Income Investments”
Latest 24 Month Return
Monthly Return Since Inception
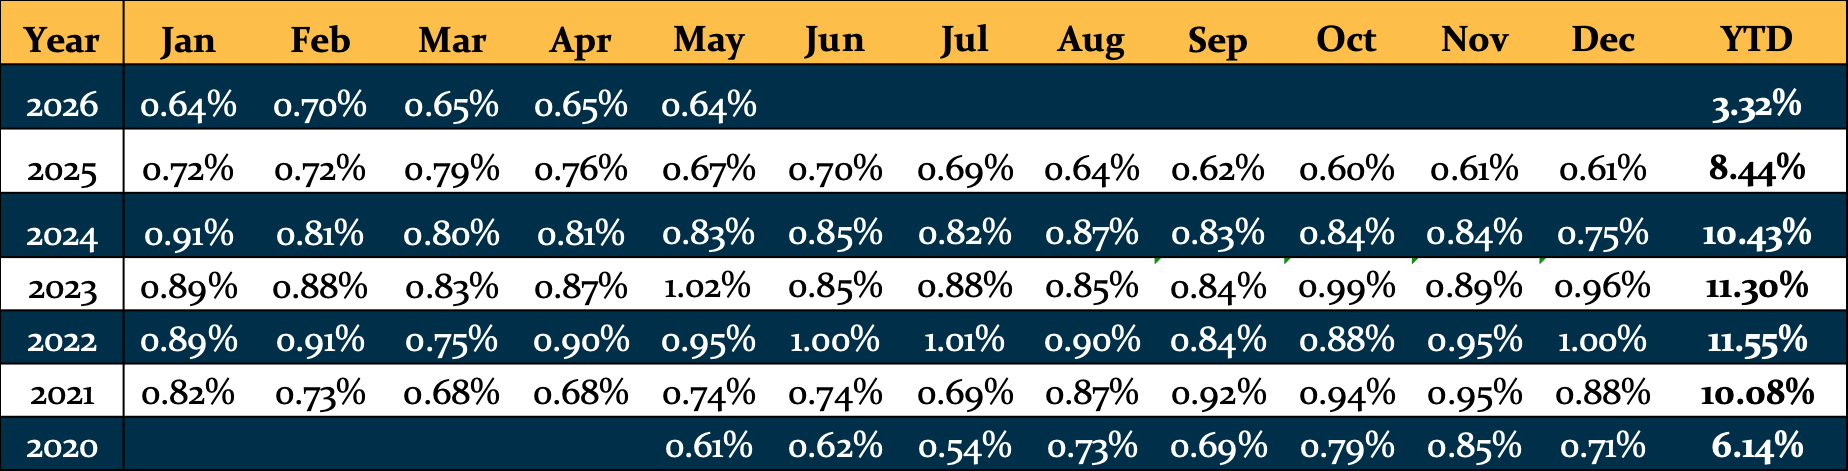
0%
Largest 1 Month Loss
0%
Max Peak to Valley Drawdown
(Monthly return swing from the highest to lowest)
Comparison to Traditional Asset Classes
Return Versus Public Indices

Return Versus Bonds

Footnote: Until April 2023, we used the Bloomberg U.S. Aggregate Bond Index and then switched to the SPDR® Bloomberg U.S. Aggregate Bond ETF.
Comparison to Traditional Asset Classes
Trailing 12-Month Return Comparison
A recent-period view of KIF alongside selected traditional asset classes.
As of May 2026
Equity Assets
Fixed Income Assets
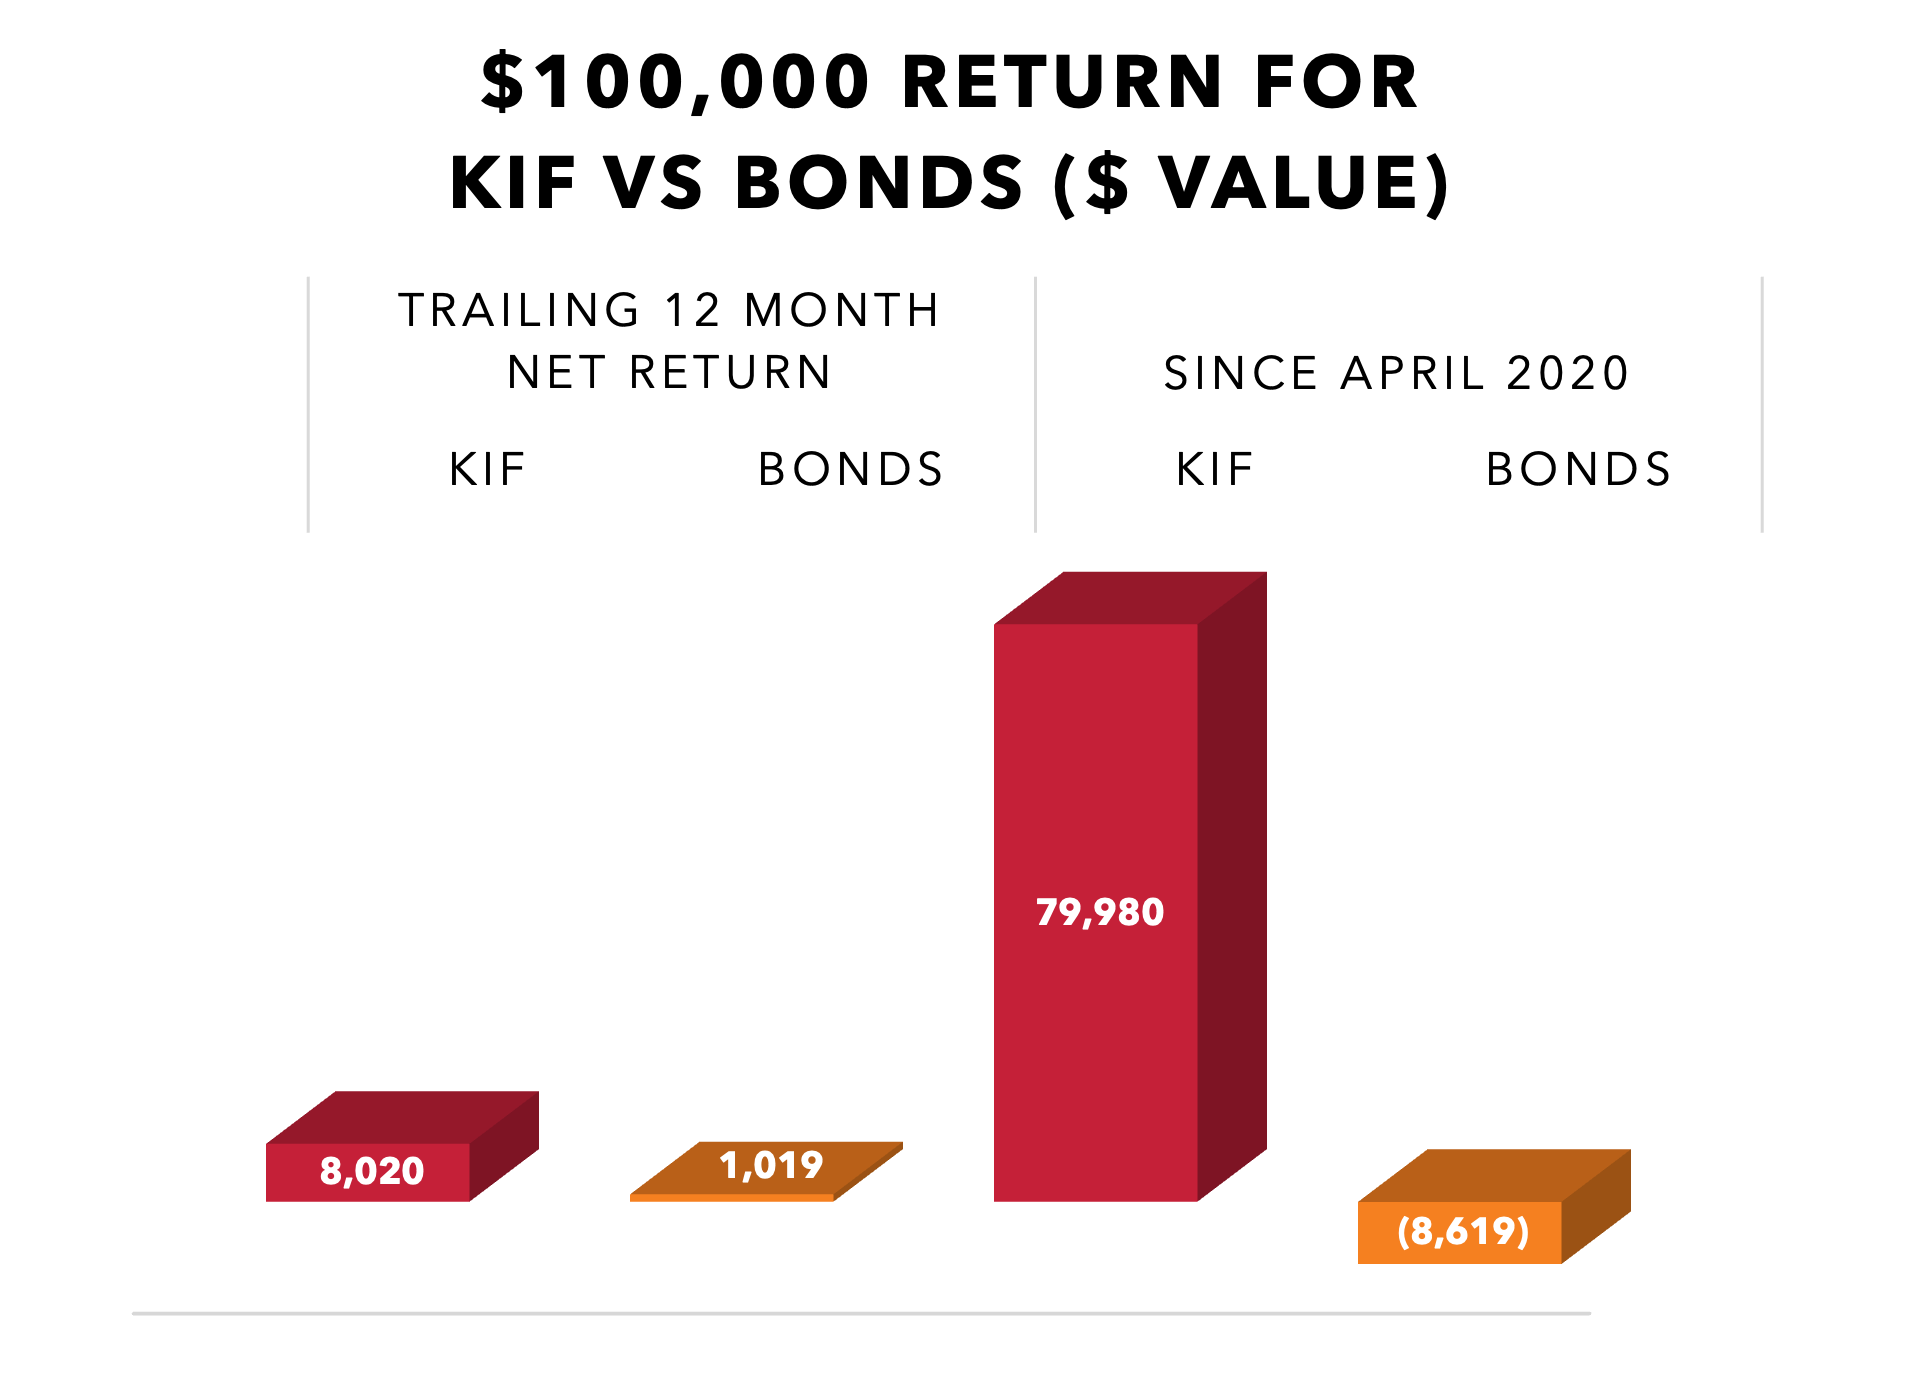
Since April 2020
Growth of a $100,000 Investment
Hypothetical ending value based on historical return data.
Kirkland Income Fund
+$79,980 since inception.
SPDR Aggregate Bond ETF
-$8,619 since inception.
Return figures are based on historical monthly return data and are provided for informational purposes only. The $100,000 comparison is hypothetical and shown for illustrative purposes. Past performance is not indicative of future returns.
Equity Like Returns with Debt Level Risk
Related Resource: “Equity Like Returns with Debt Level Risk: Dream or Reality”
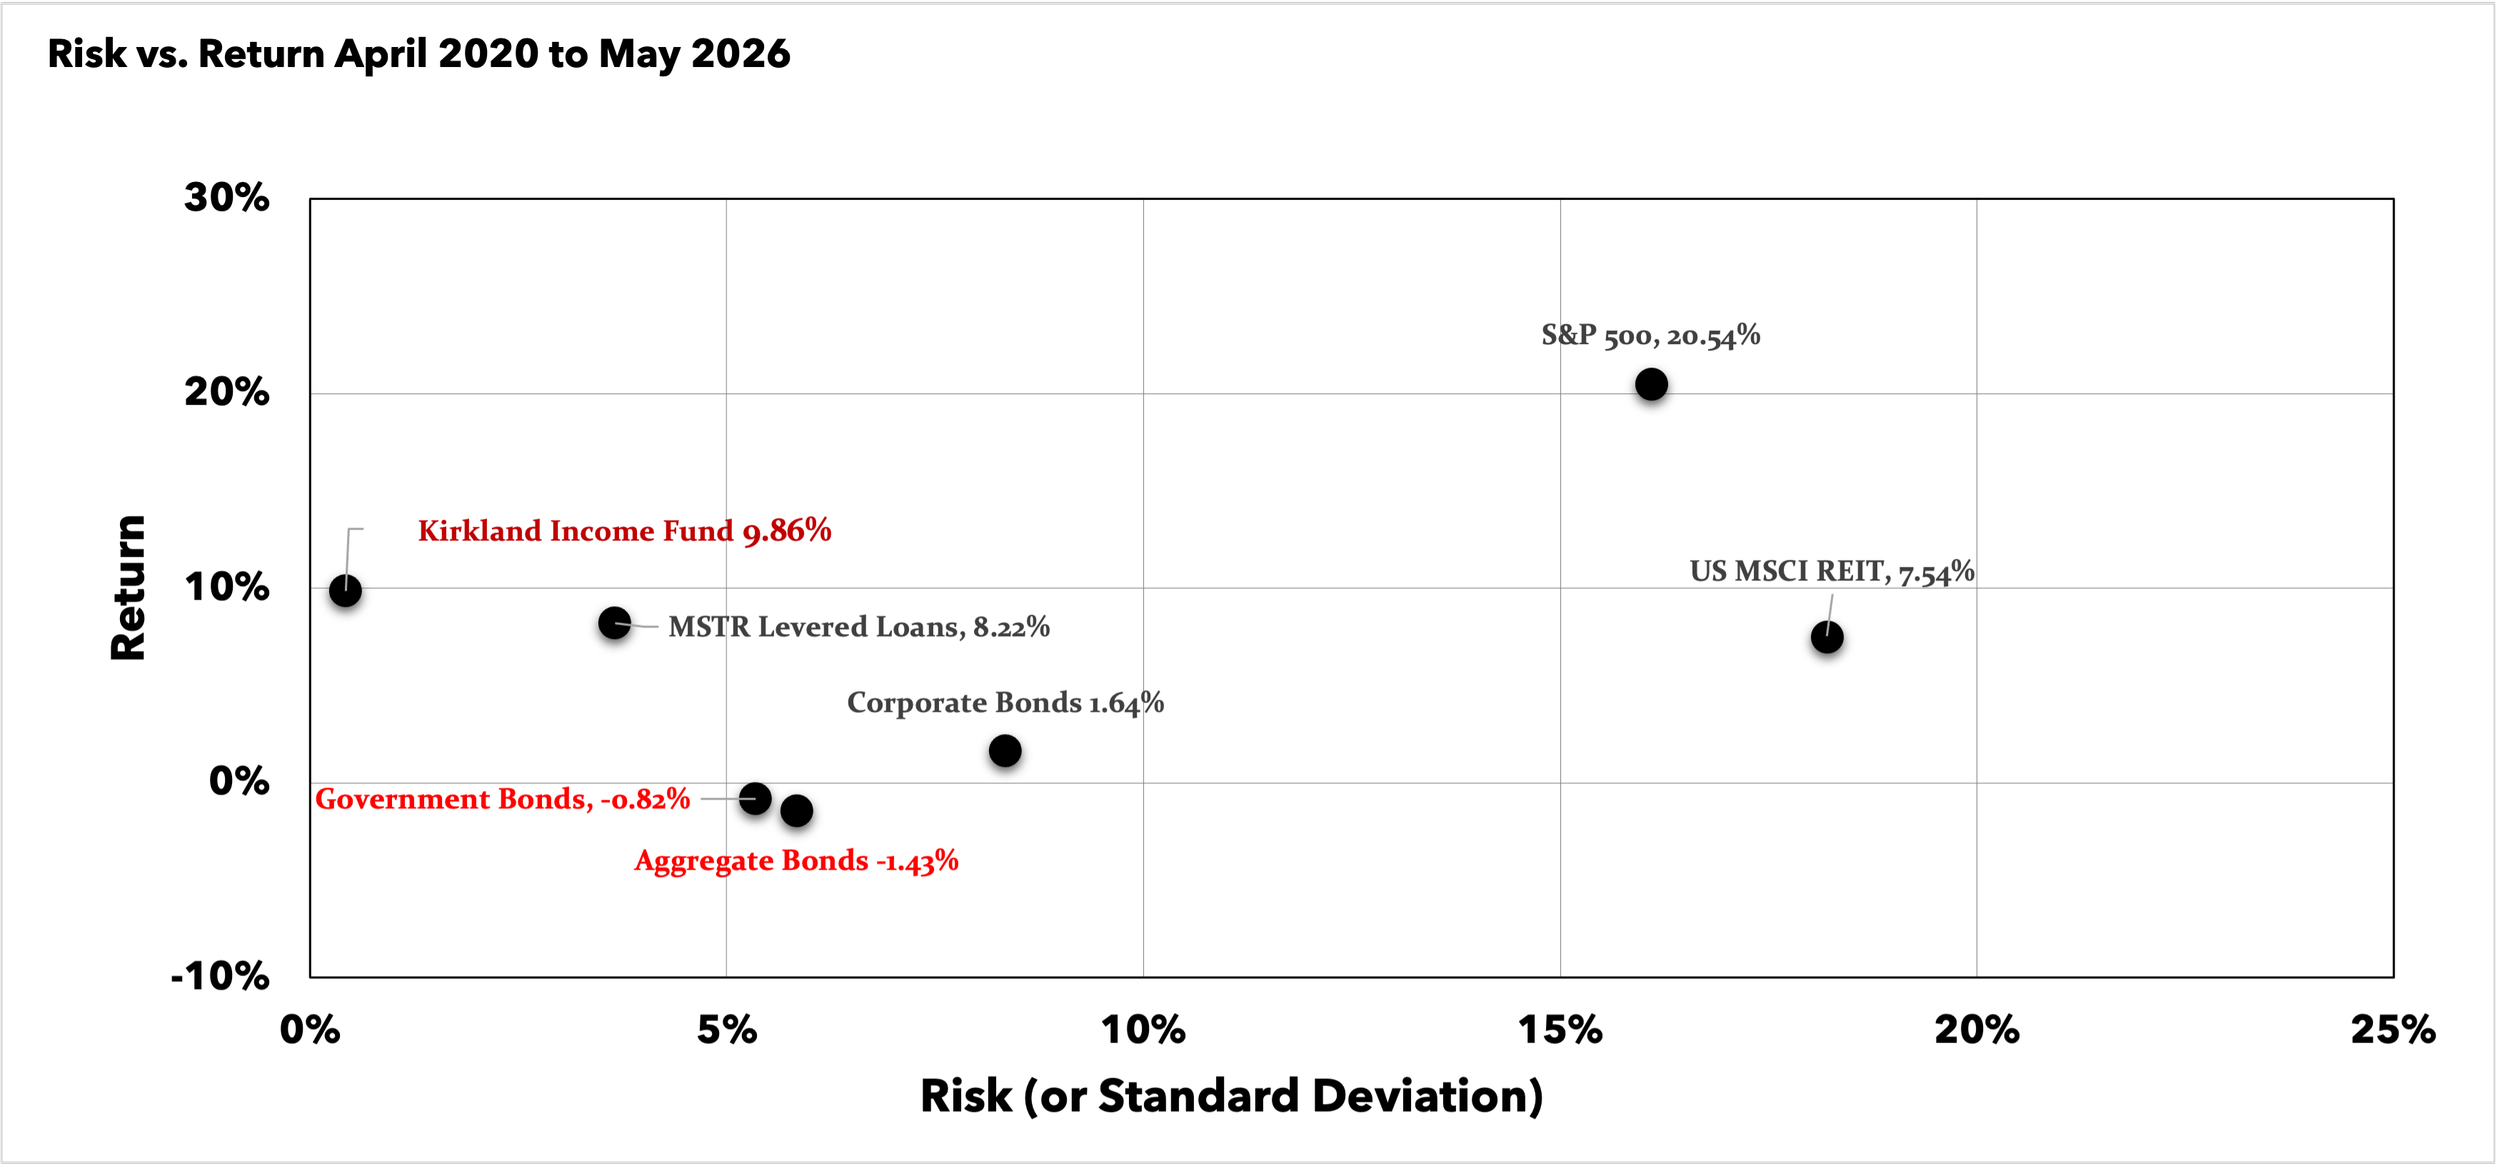
Standard deviation is a statistical measurement of how far a variable, such as an investment's return, moves above or below its average (mean) return. An investment with high volatility is considered riskier than an investment with low volatility; the higher the standard deviation, the higher the risk. The lower the standard deviation (closer to 0), the lower the risk.
Correlation
April 2020 to May 2026
It is the statistical measure that indicates the strength of a linear relationship between two or more variables. Understanding the relationships or correlations between the investments in your portfolio is foundational in determining if you are diversified enough.
-1 = Inverse Correlation, 0 = No Correlation, 1 = Positive Correlation
KIF Correlation to Indices
-0.20
S&P 500 TR Index
-0.03
SPDR Bloomberg Aggregate Bond ETF
-0.11
MSCI US REIT Index
-0.20
MSTR Levered Loans
Indices Correlations
S&P 500 TR Index to:
0.61
SPDR Bloomberg Aggregate Bond ETF
0.82
MSCI US REIT Index
0.59
MSTR Levered Loans
SPDR Bloomberg Aggregate Bond ETF to:
0.34
MSTR Levered Loans
0.60
MSCI US REIT Index
MSCI US REIT Index to:
0.47
MSTR Levered Loans
April 2020 to May 2026
Traditional Asset Correlations
Correlations among selected major public market indices.
S&P 500 Total Return
SPDR Aggregate Bond ETF
MSCI US REIT Index
KIF Correlation to Major Indices
KIF correlation to the same selected public market indices.
Kirkland Income Fund
How to Read Correlation
Strong Negative Relationship
Little or No Relationship
Strong Positive Relationship
How to Read Correlation
−1.0 = Strong Negative Relationship.
0.0 = Little or No Relationship.
+1.0 = Strong Positive Relationship.
Correlation values are based on historical monthly return data and are provided for informational purposes only. Past correlation is not indicative of future correlation or performance.
Diversification Benefits
Historically low correlation to major public market asset classes.
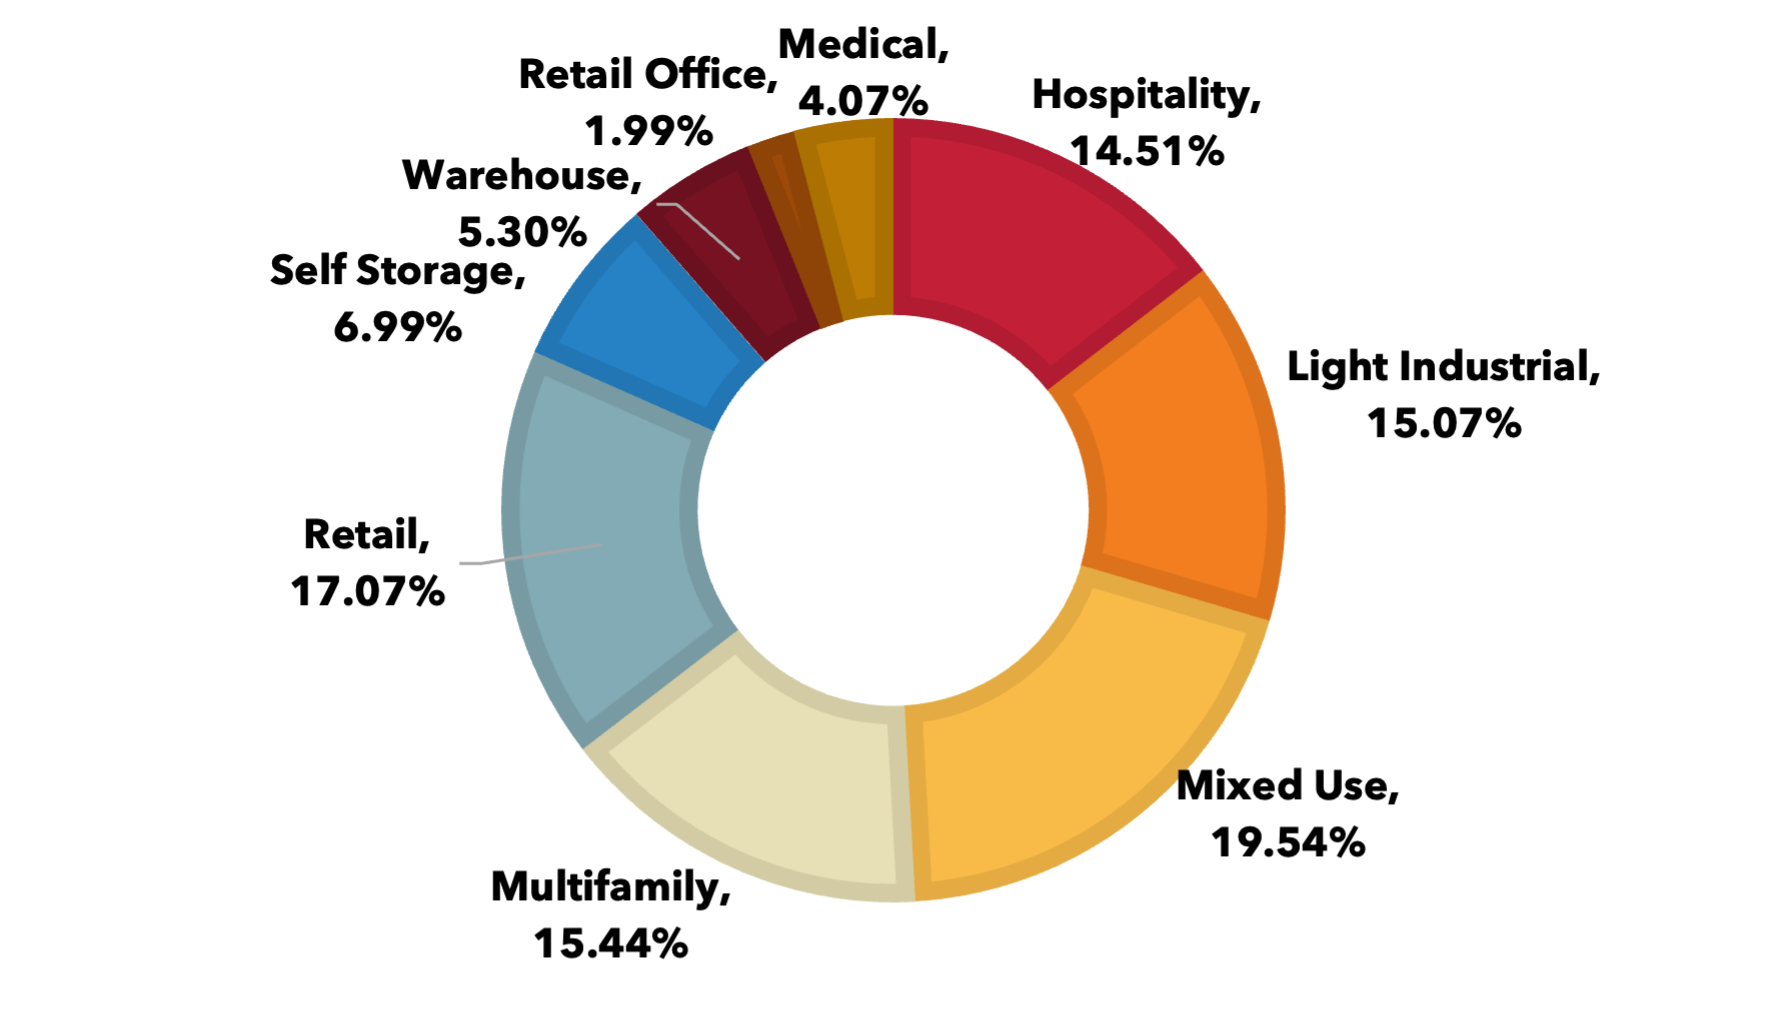
Diversified and Conservative Portfolio
Property Loan Type
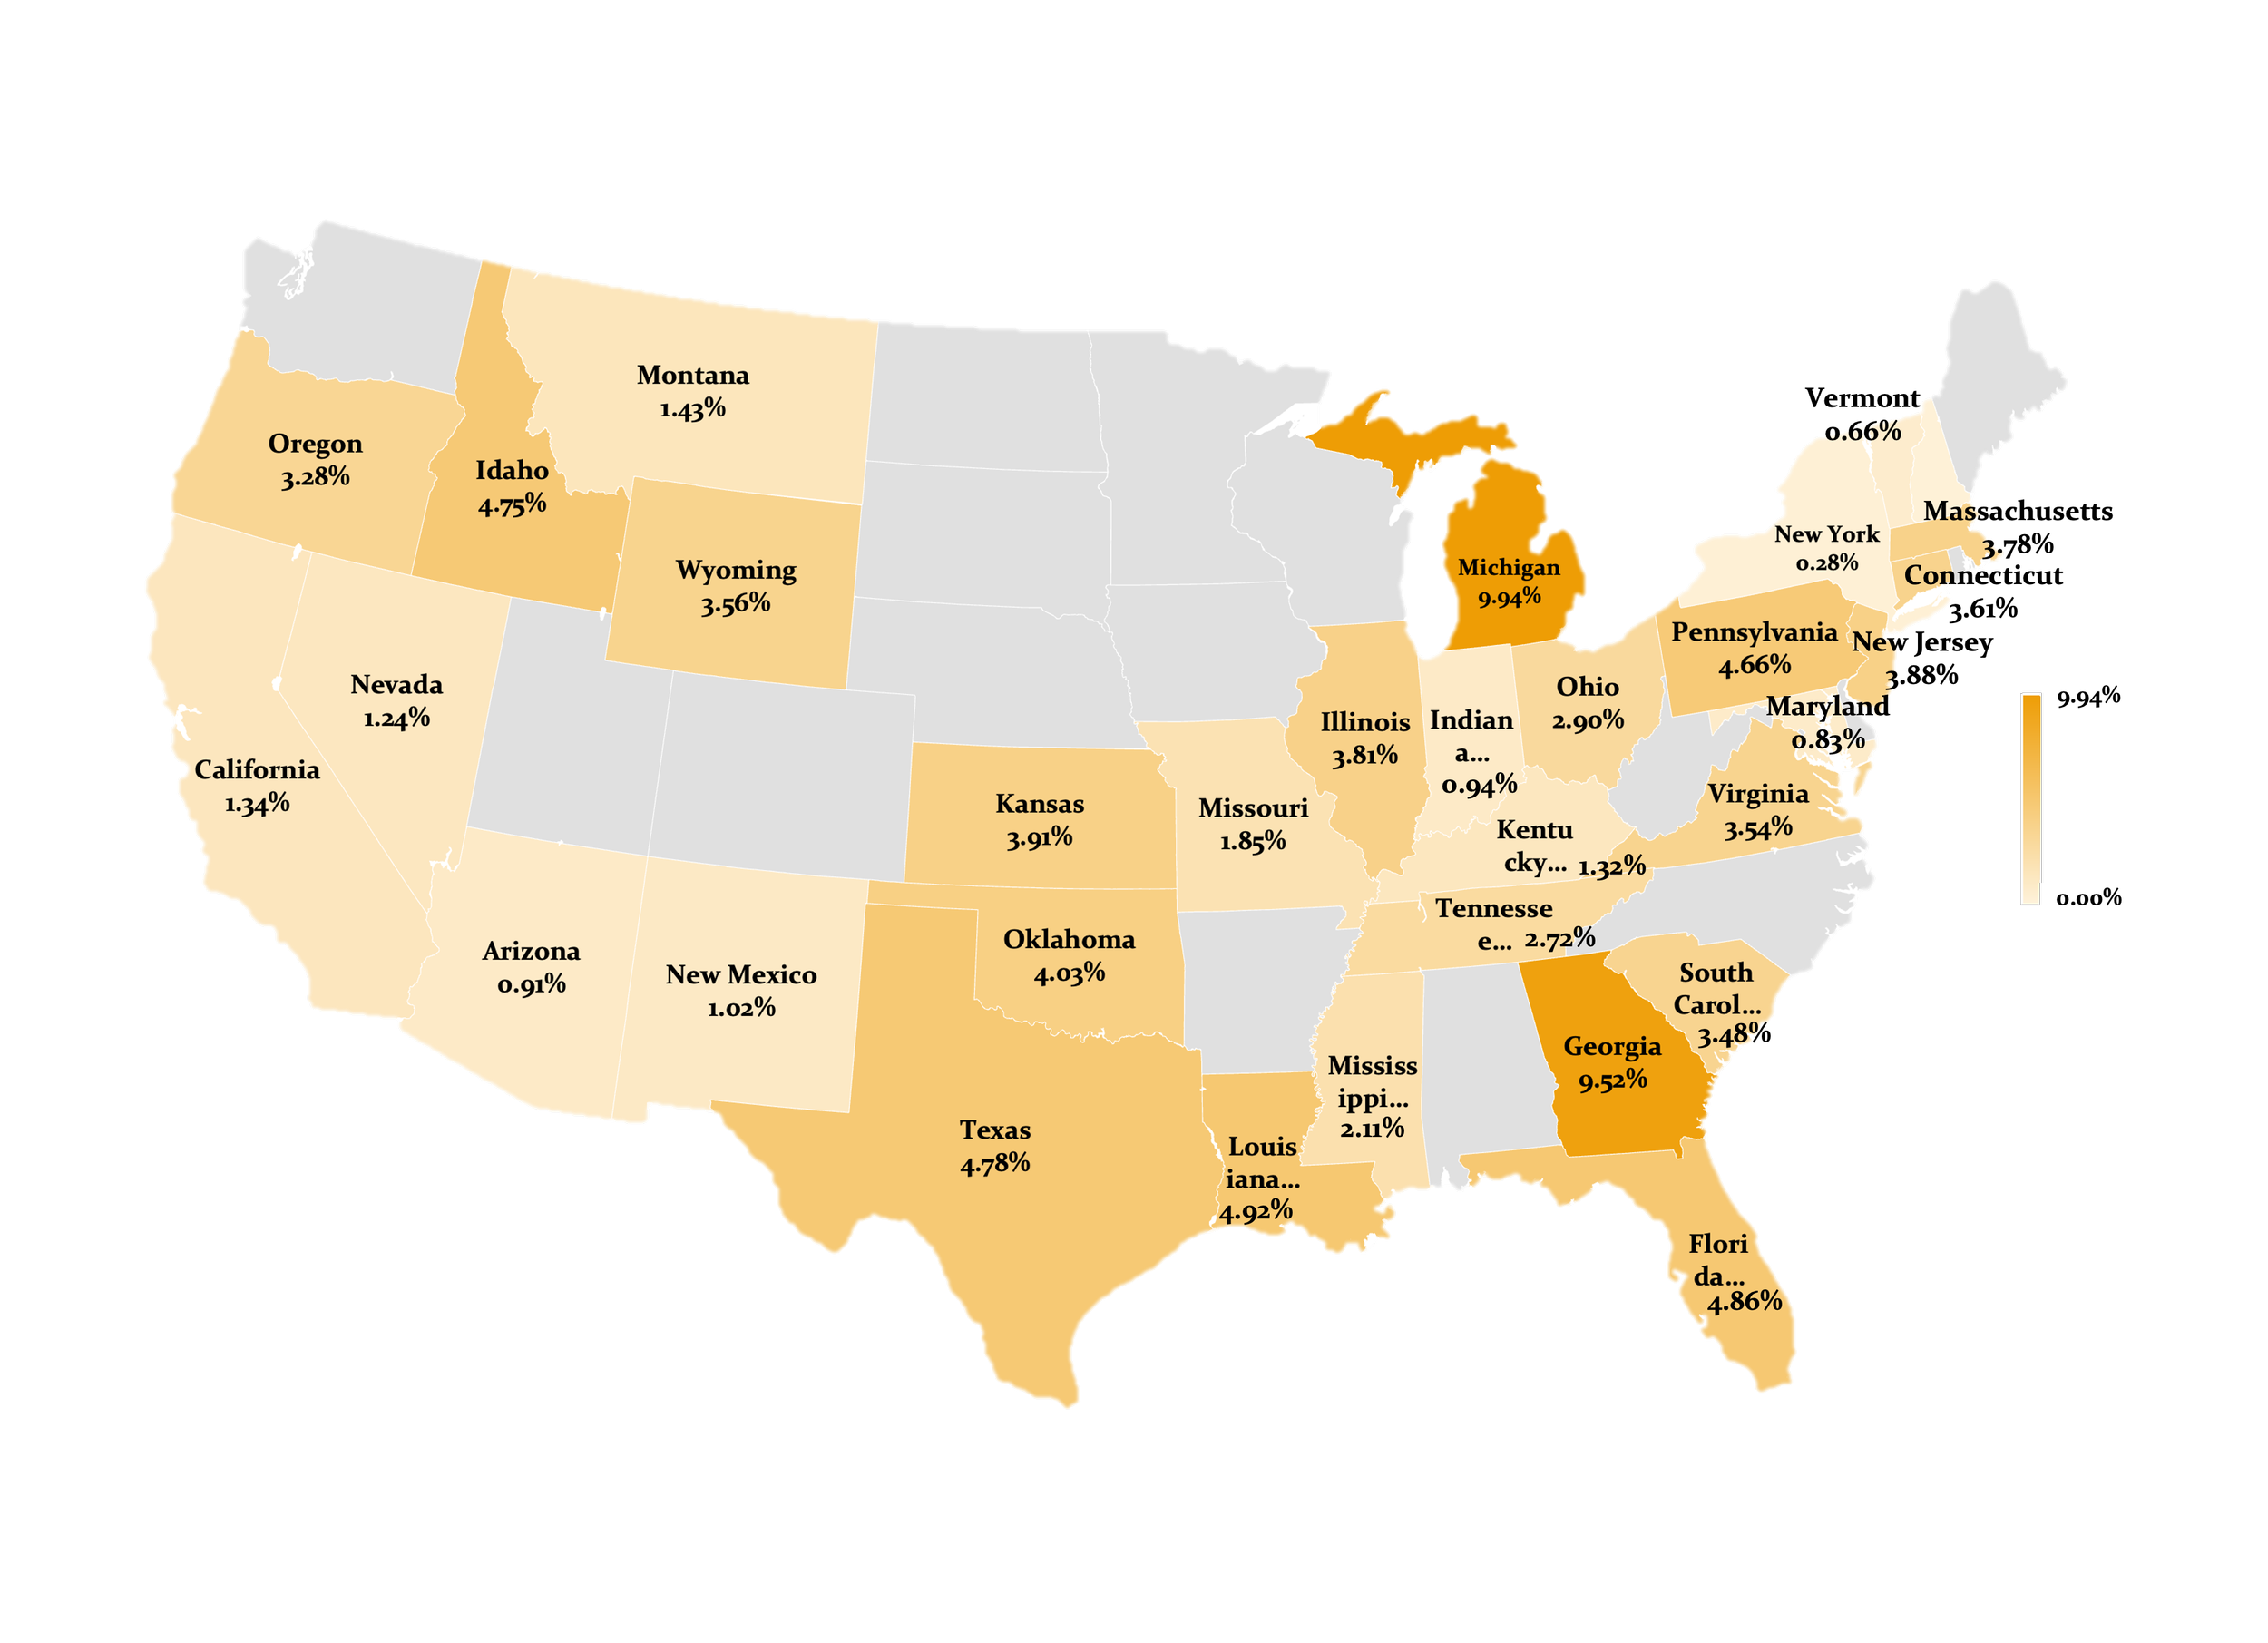
Geographical Loan Distribution
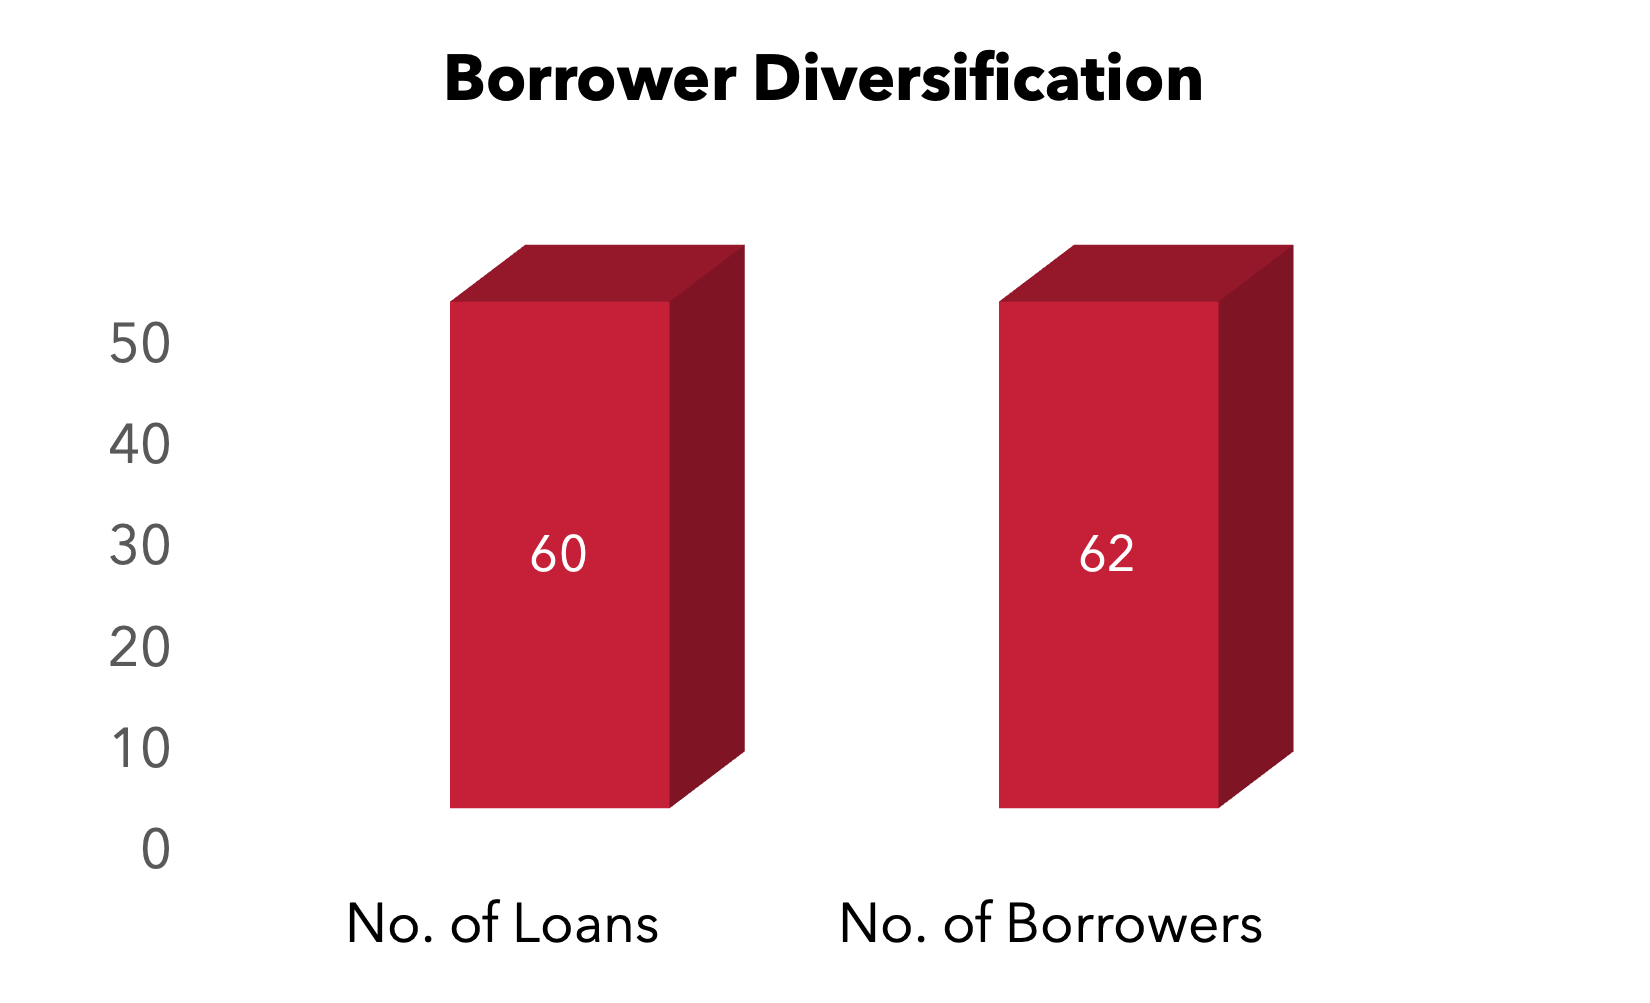
Portfolio Metrics
57.56%
Weighted Average Loan-To-Value (LTV)
7.18 Months
Weighted Average Maturity
Watch the Latest Quarterly Insights from Our Managing Partners
The videos are up to 1 hour long. We don't mind if you watch them at 2x speed. 😉
Kirkland Income Fund Investment Calculator
This calculator can be used to compute the potential future value of your private credit investment in the Kirkland Income Fund. Input the required information into the fields in the calculator, and press "Calculate" once you are done.
Be the Bank — Continue Your Review
Access the full set of Kirkland Income Fund documents, reviewed by more than two hundred accredited investors before investing.